
(the "Company")
RESULTS FOR THE SIX MONTHS ENDED
The Directors of
You may view the Interim Report in due course on the
FOR FURTHER INFORMATION ON THE COMPANY, PLEASE CONTACT
|
|
Tel: 020 7201 8989 |
|
|
|
The Company's LEI is 213800AOOAQA5XQDEA89
Further information on the Company can be found on its website
https://www.triplepoint.co.uk/triple-point-venture-vct/
NOTES:
The Company is a
Financial Summary
|
|
|
Six months ended |
Year ended |
Six months ended |
|
Net assets |
£'000 |
92,615 |
83,547 |
71,149 |
|
Net asset value per share |
Pence |
93.94 |
95.44 |
97.61 |
|
Profit/(loss) before tax |
£'000 |
372 |
636 |
821 |
|
Earnings per share |
Pence |
0.39 |
0.86 |
1.17 |
|
|
|
|
|
|
|
Cumulative return to shareholders |
|
|
|
|
|
Net asset value per share |
Pence |
93.94 |
95.44 |
97.61 |
|
Total dividends paid |
Pence |
17.00 |
15.00 |
13.00 |
|
Net asset value plus dividends paid (Total Return) 1 |
Pence |
110.94 |
110.44 |
110.61 |
1 Total Return comprises current Net Asset Value plus total Dividends paid to date. Total Return is defined as an Alternative Performance Measure ("APM"). Total Return, calculated by reference to the cumulative dividends paid plus net asset value (excluding tax reliefs received by Shareholders), is the primary measure of performance in the VCT industry.
On
Key Highlights
|
Venture Share Cumulative Dividends Paid |
|
Net Asset Value per Venture Share |
|
|
|
|
||
|
17.00p |
|
93.94p |
|
|
|
|
||
|
|
|
||
|
2.00p dividends paid during the period |
|
( |
|
|
|
|
||
|
|
|
||
|
|
|
|
Total Return per Venture Share 1 |
|
Deployment |
|
|
|
|
||
|
110.94p |
|
|
|
|
|
|
||
|
|
|
||
|
Total Return for the Venture Shares includes cumulative dividends paid of 17.00 pence per share |
|
Total funds deployed during the six-month period to |
|
|
|
|
||
|
|
|
||
|
|
|
|
Fundraising |
|
Ongoing Charges Ratio |
|
|
|
|
||
|
|
|
2.97% |
|
|
|
|
||
|
|
|
||
|
|
|
|
|
|
Total gross proceeds raised under the seventh Venture Share offer which closed on |
|
The ongoing charges ratio is a ratio of annualised ongoing charges expressed as a percentage of average net asset values throughout the period (Year ended |
|
|
|
|
||
|
|
|
Chair's Statement
The Company has made good progress during the period, completing our latest fundraising, making new and follow-on investments, and with several of our portfolio companies progressing too. The portfolio grew over the period, with five new qualifying investments and five follow-on investments. In total TPV invested
Offer for subscription of Venture Shares
The last Offer for Subscription of Venture Shares closed on
The Board and the Investment Manager believe that the level of venture investment opportunity in our chosen sectors remains promising. The Company announced that it is seeking to raise a further
Portfolio overview
The Company's funds at
Since inception, we have deployed
We made ten investments in the six months under review, five of which were additional funding to support our existing portfolio companies. In fact, since inception, the Company has provided over
Market environment
Competition for the highest-quality pre-seed and seed-stage deals remained intense, with capital continuing to concentrate around a smaller number of standout companies. The view in the market is that deal total value has stabilised following a heavy fall from 2022. However, deal volume continues to decline, with values propped up by fewer, larger transactions.
Businesses with strong traction and experienced founding teams have continued to attract significant investor interest, while others have faced increasingly difficult fundraising conditions. With fewer companies being funded, the bar for progression beyond seed investment stage is much higher than during the 2021-22 boom. Founders are responding by managing capital with greater discipline, often focusing on efficient growth and internal resourcing before returning to the funding market.
Sector spotlight: AI and Climate Tech
AI has dominated venture capital activity across the UK, Europe, and the US in 2025. Nearly half of all global venture funding is now directed to AI startups[1], and generative AI is driving several record-breaking deals. Within the portfolio, we have already seen companies harnessing AI to improve efficiency and scale their operations. Nory is a platform built with AI at its core. It provides hospitality businesses with an AI-powered operating system that combines automated workforce management, inventory optimisation, and predictive performance insights. This AI-first approach enables restaurants to improve profitability, reduce waste, and adapt quickly to fluctuations in demand, underpinning Nory's strong commercial growth and customer adoption. That momentum has attracted respected institutional backers, with recent Series B funding signalling belief in Nory's model and momentum.
Other portfolio companies are using AI to enhance existing platforms. Aptem, which provides apprenticeship and skills training software, has integrated AI through its "Enhance" module. This automates repetitive administrative tasks carried out by tutors and training providers, streamlines workflows, reduces cost-to-serve, and frees up staff time for higher-value learner engagement. Together, these examples show how the portfolio captures both AI-native businesses like Nory and established platforms like Aptem, which are embedding AI to drive efficiency and remain competitive.
Despite continued political headwinds and a selective funding environment over the last 12 months, our confidence in Climate tech's long-term potential remains strong. The ongoing global transition to sustainable energy and supply chain solutions continues to create substantial opportunities. We are seeing sustained interest in start-ups that leverage software and technology to enhance efficiency and sustainability in larger businesses.
Within the portfolio, we have seen strong performance in the climate sector, most notably from Treefera. It is the leading AI-enabled data fabric for supply chain resilience and recently secured a
Portfolio valuations and performance
I am happy to report that some strong revenue growth at a number of our companies has led to several funding rounds delivering the Company's net asset value (NAV) total return of 110.94p per share, an increase on the NAV total return as at
Seven portfolio companies successfully closed additional funding during the period, five of which were at higher valuations, driving upward momentum in the portfolio. A further two companies in the portfolio received term sheets for additional funding and are in the process of closing these funding rounds. The Ventures team has continued to support portfolio companies during the period, investing in five of the seven portfolio company funding rounds. While the team is keen to support existing portfolio companies, it does not always invest in further funding rounds where it believes it is not in the best interests of the Company. This can be for a variety of reasons, such as concerns over valuation, lack of sufficient progress since the previous investment, lack of confidence in the direction of the company, concerns over capital efficiency or concerns over management.
The valuation gains mentioned above were partly offset by 13 unrealised fair valuation reductions and one realised loss made during the period due to individual portfolio companies' commercial performance or inability to raise new funding. This is to be expected in an early stage venture portfolio and is covered in more detail in the Investment Manager's review.
ESG Integration
Both the Board and the Investment Manager believe Environmental Social and Governance (ESG) considerations are important, and they are taken into account through the Company's investment process. While early-stage companies do not always have the scale or resources to adopt the full spectrum of ESG initiatives open to large corporates, we always check the processes and policies they have in place. This ensures they are proportionate to their size and activities. We also promote ways in which portfolio companies can adopt ESG initiatives.
Dividends
I am delighted to report that during the period under review a dividend of
Outlook
Macroeconomic conditions have shifted slightly since February.
Investors should remain aware that NAV volatility may remain high, influenced by global venture capital valuation trends, the commercial performance of portfolio companies and by geopolitical events. Overall, we remain optimistic in the growth potential of the Company's existing diverse portfolio of software businesses and in the new opportunities ahead of us.
If you have any questions about your investment, please do not hesitate to contact TPIM on 020 7201 8990.
Jamie Brooke
Chair
11
Sector Analysis
The Unquoted Investment Portfolio can be analysed as follows:
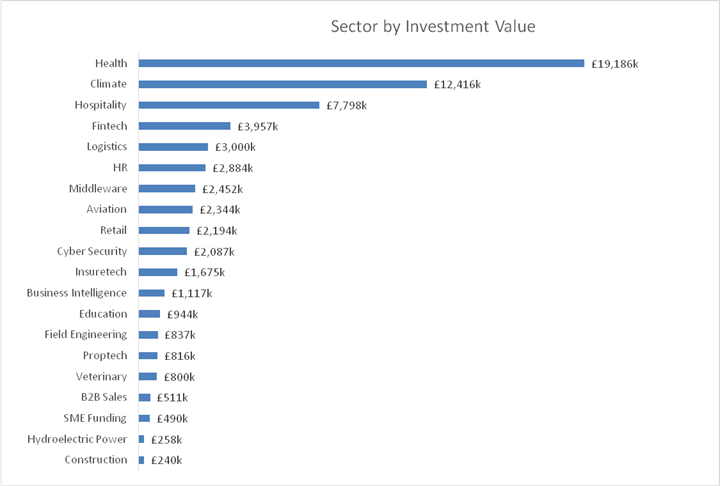

*Under current VCT regulations, the Company has three years before undeployed cash counts towards the qualifying status of the Company. The qualifying status percentage of the Company remains above 80%.
Investment Manager's Review
We are pleased to present the interim review for the six months ended
Over the last six months, the team invested a total of
Market environment
Despite easing interest rates over the past six months, which have created a slightly more favourable funding backdrop, venture funds have remained more selective in recent years. This places a premium on quality - businesses with exceptional teams, strong execution, and defensible technology are attracting capital, while weaker companies struggle.
Against this backdrop, we are encouraged that several of our portfolio leaders have continued to attract top-tier investors. Recent funding rounds in Nory and Treefera have brought in highly regarded institutional backers, validating both the underlying businesses and our ongoing support. Since inception, the Ventures team has now provided over
Portfolio Valuations
During the six months to
The Ventures team also adjusted down the carrying values of 13 companies during the period. While such movements are a natural feature of early-stage investing, they were balanced by the resilience shown across the broader portfolio. Importantly, these losses were not unexpected. The majority of the companies that have been written down had been long-term concerns to the Ventures team, and we already held downward fair value adjustments to the valuations of the majority of these companies.
As the portfolio continues to mature, we anticipate that the stronger performers will continue to capitalise on their momentum, raising additional rounds and scaling into new markets. At the same time, it is realistic to expect that some weaker businesses will continue to face difficulty attracting investment, which may ultimately result in further write downs, failures or distressed exits. With an average portfolio company hold period of 3.5 years, we are beginning to observe this pattern, with a divergence between those that accelerate and those that fall behind. While write-downs and losses are disappointing for both us and the founders who have worked tirelessly on their ventures, setbacks are an unavoidable feature of venture investing. The expectation remains that the outperformance of our successful investments will more than compensate for the underperformers.
Importantly, TPV's overall NAV has remained stable over the past two years, supported by this disciplined valuation approach and the strong performance of several key holdings. Dividends have continued to be paid consistently. We believe this demonstrates both the resilience of the portfolio and the benefits of diversification across companies, sectors, and the timing of investments over different years.
Capital Management
Beyond venture investments, the Company continues to hold the majority of its liquid funds in money market and corporate bond vehicles. In today's higher interest rate environment, this provides enhanced returns on cash reserves versus bank deposits while remaining fully compliant with VCT rules.
Investments during the period:
New Investments:
· An enterprise-wide AI procurement and monitoring platform for hospitals, designed to be vendor-neutral - that is, not tied to any single provider of AI-powered products or services.
· Real-time fraud prevention software leveraging AI and advanced data analytics.
· A fintech platform delivering tailored health and financial products for the 55+ age group, mass affluent market.
· An AI-driven logistics system for automotive dealerships and transport providers, streamlining vehicle movements.
· A UK healthcare workforce platform providing remote,
Follow-On Investments:
· AeroCloud: AI-powered, cloud-native airport management software.
· Kohort: A machine learning platform for financial forecasting and revenue prediction.
· Treefera: AI-enabled "data fabric" for carbon projects and commodity supply chains.
·
· Nory: An AI-powered operating system for restaurants and hospitality businesses.
Company Spotlight: Treefera
Treefera delivers an AI-enabled forestry data platform that aggregates global satellite and drone imagery, transforming it into actionable indicators of forest volume and health. This enables accurate carbon project assessment, deforestation risk analysis, and support for project developers entering the carbon markets.
The team brings exceptional technical and commercial expertise. CEO Jonathan Horn, a former JP Morgan Managing Director with a PhD in Fluid Dynamics, has deep expertise in data infrastructure and risk analytics. Chief Revenue Officer Caroline Grey scaled UiPath from Series A to IPO as Chief Customer Officer. Together, they bring the execution capability and networks needed to build a market leader.
Treefera's product integrates seamlessly via API, providing enterprise customers with reliable insights for compliance, sustainability, and risk management. By focusing on monitoring, reporting, and verification (MRV), Treefera occupies a defensible niche within both the carbon markets and supply chain transparency sectors - two markets undergoing rapid expansion.
The Ventures team first backed Treefera at Series A, when the business was valued at
Falling costs of satellite imagery and computer power are enabling rapid advances in AI and machine learning, which underpin Treefera's product. The new capital will allow the business to expand across North America, Asia-Pacific, and Europe while further strengthening its data and AI capabilities.
Outlook
Our investment strategy continues to rest on three core principles:
· Investing early: Early-stage entry points maximise long-term return potential.
· Backing B2B companies: This segment consistently delivers stronger exit outcomes than consumer-focused businesses[2].
· Diversification: Broad exposure across sectors, stages, and company vintages reduces risk and enhances resilience.
While some portfolio companies have faced headwinds, the easing base rate environment, reset valuations, and accelerating demand for AI-driven solutions create a favourable backdrop for UK seed-stage investing. We expect deal flow to remain robust, pricing to stay rational, and competition to remain moderated - conditions that favour active investors with capital, conviction, and follow-on capacity.
More broadly, venture capital itself is shifting. A decade of "plain vanilla" software as a service has given way to a new wave of companies where AI is driving step-changes in efficiency, automation, and decision-making. Opportunities now lie not just in incremental improvements but in businesses applying defensible AI to transform industries from healthcare to climate. These are precisely the kinds of opportunities the Ventures team is focused on identifying and backing.
As mentioned in the Chair's Statement, the Company launched a new Offer for Subscription on 5 September 2025. This will provide us with additional capital to continue supporting the existing portfolio while pursuing fresh investment opportunities and leveraging the fixed cost base of the Company.
The Venture team remains excited about the outlook, confident in the resilience of the current portfolio, and committed to sourcing and supporting the next generation of category-defining B2B software companies.
Seb Wallace
Head of Ventures
For Triple Point Investment Management LLP
11 November 2025
Investment Portfolio Summary
For the six months ended 31 August 2025
|
|
||||||||||||||||||||||||||||||||||||||||||||||||||||||||||||||||||||||||||||||||||||||||||||||||||||||||||||||||||||||||||||||||||||||||||||||||||||||||||||||||||||||||||||||||||||||||||||||||||||||||||||||||||||||||||||||||||||||||||||||||||||||||||||||||||||||||||||||||||||||||||||||||||||||||||||||||||||||||||||||||||||||||||||||||||||||||||||||||||||||||||||||||||||||||||||||||||||||||||||||||||||||||||||||||||||||||||||||||||||||||||||||||||||||||||||||||||||||||||||||||||||||||||||||||||||||||||||||||||||||||||||||||||||||||||||||||||||||||||||||||||||||||||||||||||||||||||||||||||||||||||||||||||||||||||||||||||||||||||||||||||||||||||||||||||||||||||||||||||||||||||||||||||||||||||||||||||||||||||||||
Principal Risks and Uncertainties
Principal Risks and Uncertainties and Emerging Risks
The Directors seek to mitigate the Company's principal risks by regularly reviewing performance and monitoring progress and compliance. In the mitigation and management of these risks, the Directors carry out a robust assessment of the Company's emerging and principal risks, including those that would threaten its business model, future performance, solvency or liquidity and reputation.
The main areas of risk identified by the Company, including those arising from its operational and investing activities, are detailed below. The Board maintains a comprehensive risk register, reviewed at least twice a year by the Audit Committee, which sets out the risks affecting both the Company and its investee companies. This forms part of a broader risk management framework that categorises risks as Strategic, Financial (including Investment and Liquidity), and Non-Financial (including Operational, Regulatory and Governance). The risk register also identifies emerging risks to determine whether any actions are required. As it is not possible to eliminate risks completely, the purpose of the Company's risk management policies and procedures is to identify and manage risks, reducing possible adverse impacts.
The Directors have reviewed the current register and can confirm that the risk landscape is broadly unchanged and the risks presented remain stable with no material changes to report.
Summary of Principal Risks and Mitigations
|
Risk Category |
Risk Description |
Mitigation |
Change in year |
|
VCT Qualifying Status Risk |
The Company is always required to observe the conditions laid down in the Income Tax Act 2007 for the maintenance of approved VCT status. The loss of such approval could lead to the Company losing its exemption from corporation tax on capital gains, to investors being liable to pay income tax on dividends received from the Company, and, in certain circumstances, to investors being required to repay the initial income tax relief on their investment.
|
The Investment Manager keeps the Company's VCT-qualifying status under continual review and reports to the Board at Board Meetings. Philip Hare & Associates LLP undertake an independent annual review on the VCT status. Any new Venture investments are reviewed by legal advisers, and their opinion sought on whether the investment meets the criteria to be a qualifying investment.
|
No change. |
|
Investment Risk |
The Company's VCT-qualifying investments will be held in small and medium-sized unquoted investments which, by their nature, entail a higher level of risk and lower liquidity than investments in large, quoted companies, impacting both returns and timings. |
The Directors and Investment Manager aim to limit the risk attached to the portfolio by careful selection and timely realisation of investments, by carrying out due diligence procedures appropriate to the size of each investment and by maintaining a spread of holdings both in terms of industry and in terms of the total number of portfolio companies that presently numbers approximately 50.
The Board reviews the investment portfolio with the Investment Manager on a regular basis. Where possible, a member of the Investment Manager team either holds a seat on the board of the portfolio companies or has the right to act as a board observer. This enables the Investment Manager to observe developments at the portfolio company and offer assistance when and where this may be required. The strategy aims to mitigate some of the risks typically associated with venture capital investing by proactively working with businesses with the potential for high growth that are typically actively solving problems for established corporates, increasing their chances of success.
|
No Change.
|
|
Financial Risk |
The Company is exposed to market price risk, interest rate risk, credit risk, foreign currency risk and liquidity risk. As most of the Company's investments will involve a medium to long-term commitment and will be relatively illiquid, the Directors consider that it is inappropriate to finance the Company's activities through borrowing, other than for short-term liquidity.
|
At the reporting date, the Company had no borrowings and substantial liquid funds. |
No Change.
|
|
Legislation Risk |
There is a risk of changes to legislation and/or Government Policy, caused by government taking a different approach which could result in changes to the tax status of or rules governing VCTs. |
There is a practice of consultation before any major changes are implemented. It is important that the Company can respond proactively to any changes and understand what, if any, impact they will have. |
No Change.
|
Emerging Risks
Climate Change Risk
Due to the medium to long-term time horizon of Climate Change, this risk is deemed as an emerging risk in the context of the investments made by the VCT.
Climate Change or related legislation is considered unlikely to have a major near-term impact on the Company, as the vast majority of the portfolio is made up of a diversified range of software-based businesses. Each prospective new company holding is considered with regard to how it may be impacted by climate change, particularly in relation to sources of energy and costs associated with data storage, and how this could in turn affect future growth. Should it be relevant, the possible impact of other physical and transitional risks will be considered.
Triple Point, as Investment Manager, is committed to sound management of climate risk and opportunity to ensure the long-term protection of asset value through reduction of exposure to the risk and also to contribute to essential carbon reduction requirements. The Investment Manager has published near-term science aligned Net Zero targets. These targets are available in Triple Point's annual Sustainability Report and also via the Net Zero Asset Managers Initiative of which Triple Point are signatories. We note that NZAM have been undergoing a consultation on their structure, in which we have participated. Results of this consultation will be reviewed to determine if there will be any change to Triple Point's existing approach. Triple Point also publish a Carbon Reduction Plan which is available on its website.
Artificial Intelligence (AI) Risk
Artificial Intelligence (AI) continues to evolve rapidly, presenting both opportunities and emerging risks for the financial services sector. While AI technologies have the potential to enhance efficiency, improve decision-making, and create new investment insights, their increasing adoption also introduces several areas of uncertainty and potential disruption.
Triple Point as Investment Manager continue to monitor developments in AI closely, both as a source of innovation and as a potential source of volatility. The Board, in conjunction with the Investment Manager, will remain vigilant in assessing AI-related exposures and adjusting the risk framework accordingly to protect shareholder interests.
Macroeconomic Conditions
A turbulent global macroeconomic environment threatens early-stage startups' growth and fundraising prospects. After the pandemic-era boom, monetary tightening and inflation have created a "new normal" of higher interest rates and cautious capital markets.
As a consequence, B2B startups find it harder to win new contracts as customers tighten spending and therefore face greater challenge in demonstrating a clear path to profitability. Moreover, higher interest rates and weaker public markets reduce exit opportunities (fewer IPOs or acquisitions), potentially lengthening holding periods.
In addition to macroeconomic risk, any sustained deterioration of trust, liquidity or capital in the banking sector could have a material impact on existing portfolio companies, given their reliance on existing cash reserves to fund their costs. The Investment Manager continues to closely monitor the cash position of portfolio companies.
Geopolitical Instability and Supply Chain Disruption
Heightened geopolitical tensions and conflicts worldwide pose an emerging risk that can ripple into the UK tech startup scene. Ongoing wars and geopolitical frictions - from the Russia-Ukraine conflict to US-China tech/trade disputes - have destabilising effects on supply chains, energy prices, and investor confidence.
Triple Point's diversified sector approach offers some hedge - for instance, digital health or fintech ventures might be less directly affected by manufacturing supply shocks - but broad instability and market volatility caused by geopolitical events can dampen exit markets and investor sentiment across all sectors.
Directors' Responsibility Statement
The Directors confirm that to the best of their knowledge that:
a) the Interim Report includes a fair review of important events during the period and their effect on the Condensed Financial Statements and a description of specific risks and uncertainties for the remainder of the accounting period as required by DTR 4.2.7;
b) the Condensed Financial Statements, which has been prepared in accordance with the UK adopted International Accounting Standard 34 "Interim Financial Reporting" following the same principles for recognising and measuring as when preparing annual financial reports, give a true and fair view in accordance with IFRS of the assets, liabilities, financial position and of the results of the Company for the period as required by DTR 4.2.4 and complies with IFRS and the Companies Act 2006; and
c) the Interim Report includes a fair review of related party transactions and changes therein as required by DTR 4.2.8.
This Interim Report has not been audited or reviewed by the auditors.
Jamie Brooke
Chair
11 November 2025
Unaudited Statement of Comprehensive Income
For the six months ended 31 August 2025
|
|
|
Unaudited |
|
Audited |
|
Unaudited |
||||||
|
|
|
Six months ended |
|
Year ended |
|
Six months ended |
||||||
|
|
|
31 August 2025 |
|
28 February 2025 |
|
31 August 2024 |
||||||
|
|
Note |
|
|
|
|
|
|
|
||||
|
|
|
Revenue |
Capital |
Total |
|
Revenue |
Capital |
Total |
|
Revenue |
Capital |
Total |
|
|
|
£'000 |
£'000 |
£'000 |
|
£'000 |
£'000 |
£'000 |
|
£'000 |
£'000 |
£'000 |
|
Investment income |
5 |
489 |
- |
489 |
|
1,096 |
- |
1,096 |
|
584 |
- |
584 |
|
Gains on investments |
|
- |
1,160 |
1,160 |
|
- |
1,799 |
1,799 |
|
- |
1,303 |
1,303 |
|
|
|
|
|
|
|
|
|
|
|
|
|
|
|
Investment return |
|
489 |
1,160 |
1,649 |
|
1,096 |
1,799 |
2,895 |
|
584 |
1,303 |
1,887 |
|
|
|
|
|
|
|
|
|
|
|
|
|
|
|
Investment management fees |
6 |
86 |
778 |
864 |
|
139 |
1,250 |
1,389 |
|
65 |
588 |
653 |
|
Other expenses |
|
328 |
85 |
413 |
|
757 |
113 |
870 |
|
413 |
- |
413 |
|
|
|
|
|
|
|
|
|
|
|
|
|
|
|
|
|
414 |
863 |
1,277 |
|
896 |
1,363 |
2,259 |
|
478 |
588 |
1,066 |
|
|
|
|
|
|
|
|
|
|
|
|
|
|
|
Profit before taxation |
|
75 |
297 |
372 |
|
200 |
436 |
636 |
|
106 |
715 |
821 |
|
|
|
|
|
|
|
|
|
|
|
|
|
|
|
Taxation |
8 |
- |
- |
- |
|
- |
- |
- |
|
- |
- |
- |
|
|
|
|
|
|
|
|
|
|
|
|
|
|
|
Profit after taxation |
|
75 |
297 |
372 |
|
200 |
436 |
636 |
|
106 |
715 |
821 |
|
|
|
|
|
|
|
|
|
|
|
|
|
|
|
Other comprehensive income |
|
- |
- |
- |
|
- |
- |
- |
|
- |
- |
- |
|
|
|
|
|
|
|
|
|
|
|
|
|
|
|
Total comprehensive income |
|
75 |
297 |
372 |
|
200 |
436 |
636 |
|
106 |
715 |
821 |
|
|
|
|
|
|
|
|
|
|
|
|
|
|
|
Basic & diluted earnings per share |
|
|
|
|
|
|
|
|
|
|
|
|
|
|
|
|
|
|
|
|
|
|
|
|
|
|
|
Venture Shares |
9 |
0.08p |
0.31p |
0.39p |
|
0.27p |
0.59p |
0.86p |
|
0.15p |
1.02p |
1.17p |
|
|
|
|
|
|
|
|
|
|
|
|
|
|
The total column of this statement is the Statement of Comprehensive Income of the Company prepared in accordance with UK-adopted International Accounting Standards (IAS). The supplementary revenue return and capital columns have been prepared in accordance with the Association of Investment Companies Statement of Recommended Practice ("AIC SORP" updated July 2022) in so far as it does not conflict with IAS.
All revenue and capital items in the above statement derive from continuing operations.
The Company has only one class of business and derives its income from investments made in shares and securities as well as from bank deposits and Money Market funds.
Unaudited Statement of Financial Position
At 31 August 2025
Company No: 07324448
|
|
|
Unaudited |
|
Audited |
|
Unaudited |
||
|
|
31 August 2025 |
|
28 February 2025 |
|
31 August 2024 |
||
|
|
Note |
£'000 |
|
£'000 |
|
£'000 |
||
|
|
|
|
|
|
|
|
||
|
Non-current assets |
|
|
|
|
|
|
||
|
Financial assets at fair value through profit or loss |
10 |
66,006 |
|
52,311 |
|
48,888 |
||
|
|
|
66,006 |
|
52,311 |
|
48,888 |
||
|
Current assets |
|
|
|
|
|
|
||
|
Receivables |
|
403 |
|
2,379 |
|
374 |
||
|
Cash and cash equivalents |
11 |
26,576 |
|
28,601 |
|
21,665 |
||
|
Deferred proceeds |
|
300 |
|
844 |
|
841 |
||
|
|
|
27,279 |
|
31,824 |
|
22,880 |
||
|
Total assets |
|
93,285 |
|
84,135 |
|
71,768 |
||
|
|
|
|
|
|
|
|
||
|
Current liabilities |
|
|
|
|
|
|
||
|
Payables and accrued expenses |
|
670 |
|
588 |
|
619 |
||
|
|
|
|
|
|
|
|
||
|
|
|
670 |
|
588 |
|
619 |
||
|
Net assets |
|
92,615 |
|
83,547 |
|
71,149 |
||
|
|
|
|
|
|
|
|
||
|
Equity attributable to equity holders |
|
|
|
|
|
|
||
|
Share capital |
12 |
986 |
|
875 |
|
729 |
||
|
Share premium |
|
58,784 |
|
47,472 |
|
33,397 |
||
|
Share redemption reserve |
|
191 |
|
180 |
|
178 |
||
|
Special distributable reserve |
|
30,388 |
|
33,126 |
|
34,766 |
||
|
Capital reserve |
|
3,852 |
|
3,555 |
|
3,834 |
||
|
Revenue reserve |
|
(1,586) |
|
(1,661) |
|
(1,755) |
||
|
Total equity |
|
92,615 |
|
83,547 |
|
71,149 |
||
|
|
|
|
|
|
|
|
||
|
Shareholders' funds |
|
|
|
|
|
|
||
|
|
|
|
|
|
|
|
||
|
|
|
|
|
|
|
|
||
|
Net asset value per Venture Share |
14 |
93.94p |
|
95.44p |
|
97.61p |
The statements were approved by the Directors and authorised for issue on 11 November 2025 and are signed on their behalf by:
Jamie Brooke
Chair
11 November 2025
The accompanying notes are an integral part of this statement.
Unaudited Statement of Changes in Shareholders' Equity
For the six months ended 31 August 2025
|
|
Issued Capital |
Share Premium |
Share Redemption Reserve |
Special Distributable Reserve |
Capital Reserve |
Revenue Reserve |
Total |
||||||
|
|
£'000 |
£'000 |
£'000 |
£'000 |
£'000 |
£'000 |
£'000 |
||||||
|
|
|
|
|
|
|
|
|
||||||
|
Six months ended 31 August 2025 |
|
|
|
|
|
|
|
||||||
|
Opening balance |
875 |
47,472 |
180 |
33,126 |
3,555 |
(1,661) |
83,547 |
||||||
|
Issue of Share Capital |
119 |
11,297 |
- |
- |
- |
- |
11,416 |
||||||
|
Cost of issue of Shares |
- |
(275) |
- |
- |
- |
- |
(275) |
||||||
|
Dividend reinvestment scheme |
3 |
290 |
- |
- |
- |
- |
293 |
||||||
|
Share buybacks |
(11) |
- |
11 |
(987) |
- |
- |
(987) |
||||||
|
Dividends paid |
- |
- |
- |
(1,751) |
- |
- |
(1,751) |
||||||
|
Transactions with owners |
111 |
11,312 |
11 |
(2,738) |
- |
- |
8,696 |
||||||
|
Total comprehensive income for the period |
- |
- |
- |
- |
297 |
75 |
372 |
||||||
|
Balance at 31 August 2025 |
986 |
58,784 |
191 |
30,388 |
3,852 |
(1,586) |
92,615 |
||||||
|
|
|
|
|
|
|
|
|
||||||
|
The Capital Reserve consists of: |
|
|
|
|
|
|
|
||||||
|
Investment holding gains |
|
|
|
|
8,876 |
|
|
||||||
|
Other realised losses |
|
|
|
|
(5,024) |
|
|
||||||
|
|
|
|
|
|
3,852 |
|
|
||||||
|
|
Issued Capital |
Share Premium |
Share Redemption Reserve |
Special Distributable Reserve |
Capital Reserve |
Revenue Reserve |
Total |
||||||
|
|
£'000 |
£'000 |
£'000 |
£'000 |
£'000 |
£'000 |
£'000 |
||||||
|
Year ended 28 February 2025 |
|
|
|
|
|
|
|
||||||
|
Opening balance |
632 |
23,714 |
174 |
36,418 |
3,119 |
(1,861) |
62,196 |
||||||
|
Issue of Share Capital |
244 |
23,863 |
- |
- |
- |
- |
24,107 |
||||||
|
Dividend reinvestment scheme |
5 |
480 |
- |
- |
- |
- |
485 |
||||||
|
Cost of issue of Shares |
- |
(585) |
- |
- |
- |
- |
(585) |
||||||
|
Share buybacks |
(6) |
- |
6 |
(467) |
- |
- |
(467) |
||||||
|
Dividends paid |
- |
- |
- |
(2,825) |
- |
- |
(2,825) |
||||||
|
Transactions with owners |
243 |
23,758 |
6 |
(3,292) |
- |
- |
20,715 |
||||||
|
Total comprehensive loss for the period |
- |
- |
- |
- |
436 |
200 |
636 |
||||||
|
Balance at 28 February 2025 |
875 |
47,472 |
180 |
33,126 |
3,555 |
(1,661) |
83,547 |
||||||
|
The Capital Reserve consists of: |
|
|
|
|
|
|
|
||||||
|
Investment holding gains |
|
|
|
|
7,732 |
|
|
||||||
|
Other realised losses |
|
|
|
|
(4,177) |
|
|
||||||
|
|
|
|
|
|
3,555 |
|
|
||||||
|
|
Issued Capital |
Share Premium |
Share Redemption Reserve |
Special Distributable Reserve |
Capital Reserve |
Revenue Reserve |
Total |
|
|
£'000 |
£'000 |
£'000 |
£'000 |
£'000 |
£'000 |
£'000 |
|
Six months ended 31 August 2024 |
|
|
|
|
|
|
|
|
Opening balance |
632 |
23,714 |
174 |
36,418 |
3,119 |
(1,861) |
62,196 |
|
Issue of Share Capital |
101 |
9,960 |
- |
- |
- |
- |
10,061 |
|
Cost of issue of Shares |
- |
(277) |
- |
- |
- |
- |
(277) |
|
Share buybacks |
(4) |
- |
4 |
(390) |
- |
- |
(390) |
|
Dividend paid |
- |
- |
- |
(1,262) |
- |
- |
(1,262) |
|
Transactions with owners |
97 |
9,683 |
4 |
(1,652) |
- |
- |
8,132 |
|
Total comprehensive loss for the period |
- |
- |
- |
- |
715 |
106 |
821 |
|
Balance at 31 August 2023 |
729 |
33,397 |
178 |
34,766 |
3,834 |
(1,755) |
71,149 |
|
The Capital Reserve consists of: |
|
|
|
|
|
|
|
|
Investment holding gains |
|
|
|
|
6,817 |
|
|
|
Other realised losses |
|
|
|
|
(2,983) |
|
|
|
|
|
|
|
|
3,834 |
|
|
The capital reserve represents the proportion of Investment Management fees charged against capital and realised/unrealised gains or losses on the disposal/revaluation of investments. The unrealised capital reserve is not distributable. The special distributable reserve was created on court cancellation of the share premium account. The revenue reserve, realised capital reserve and special distributable reserve under company law are distributable by way of dividend.
At 31 August 2025 the total reserves available for distribution under the Companies Act are £23.8 million (28 February 2025: £27.3 million). This consists of the special distributable reserve less realised capital losses and the revenue loss.
The Special Distributable Reserve was created following the cancellation of the Share Premium Account. The VCT Regulations restrict the distribution of this Special Distributable Reserve until a date at least three years after the financial year in which the funds were originally raised. On 31 August 2025 £15.8 million (28 February 2025: £7.0 million) of the Special Distributable Reserve was available for distribution.
Unaudited Statement of Cash Flows
For the six months ended 31 August 2025
|
|
Unaudited |
|
Audited |
|
Unaudited |
|
|
Six months ended |
|
Year ended |
|
Six months ended |
|
31 August 2025 |
|
28 February 2025 |
|
31 August 2024 |
|
|
|
£'000 |
|
£'000 |
|
£'000 |
|
|
|
|
|
|
|
|
Cash flows from operating activities |
|
|
|
|
|
|
Profit before taxation |
372 |
|
636 |
|
821 |
|
Net gain on investments during the period |
(1,160) |
|
(1,799) |
|
(1,303) |
|
Adjustment for: Interest on fixed deposits and Money Market funds |
(422) |
|
(999) |
|
(512) |
|
Cash flow used in operations |
(1,210) |
|
(2,162) |
|
(994) |
|
(Increase)/decrease in receivables |
1,976 |
|
(2,023) |
|
(18) |
|
Increase in payables |
82 |
|
105 |
|
135 |
|
Net cash flows generated/(used) in operating activities |
848 |
|
(4,080) |
|
(877) |
|
Cash flows from investing activities |
|
|
|
|
|
|
Purchase of financial assets at fair value through profit or loss |
(12,551) |
|
(7,693) |
|
(4,302) |
|
Disposal of financial assets at fair value through profit or loss |
560 |
|
461 |
|
- |
|
Interest on fixed deposits and Money Market funds |
422 |
|
999 |
|
512 |
|
Net cash flows used in investing activities |
(11,569) |
|
(6,233) |
|
(3,790) |
|
Cash flows from financing activities |
|
|
|
|
|
|
Issue of Shares* |
11,141 |
|
23,522 |
|
9,566 |
|
Buyback of Shares |
(987) |
|
(467) |
|
(390) |
|
Dividends paid |
(1,458) |
|
(2,340) |
|
(1,043) |
|
Net cash flows from financing activities |
8,696 |
|
20,715 |
|
8,133 |
|
Net (decrease)/increase in cash and cash equivalents |
(2,025) |
|
10,402 |
|
3,466 |
|
Reconciliation of net cash flow to movements in cash and cash equivalents |
|
|
|
|
|
|
Cash and cash equivalents at 1 March 2025 |
28,601 |
|
18,199 |
|
18,199 |
|
Net increase/(decrease) in cash and cash equivalents |
(2,025) |
|
10,402 |
|
3,466 |
|
Cash and cash equivalents at 31 August 2025 |
26,576 |
|
28,601 |
|
21,665 |
* Net of Share issue costs.
The accompanying notes are an integral part of this statement.
Condensed Notes to the Unaudited Interim Financial Statements
For the six months ended 31 August 2025
1. Corporate information
The Unaudited Interim Report of the Company for the six months ended 31 August 2025 was authorised for issue in accordance with a resolution of the Directors on 11 November 2025.
Triple Point Venture VCT plc is incorporated and domiciled in the United Kingdom and registered in England and Wales. The address of the Company's registered office is The Scalpel 18th Floor, 52 Lime Street, London, EC3M 7AF. The principal place of business is the office of the Investment Manager whose address is 1 King William Street, London, EC4N 7AF.
The functional and reporting currency is pounds sterling (£), reflecting the primary economic environment in which the Company operates.
The principal activity of the Company is investment. The Company's investment strategy is to offer exposure to venture capital investments and to maintain liquidity in cash or cash-based funds.
2. Basis of preparation and accounting policies
Basis of preparation
The Unaudited Interim Financial Statements of the Company for the six months ended 31 August 2025 has been prepared in accordance with IAS 34, Interim Financial Reporting and in compliance with the principles of recognising and measurement in the Statement of Recommended Practice ("SORP"): "Financial Statements of Investment Trust Companies and Venture Capital Trusts" issued by the Association of Investment Companies ("AIC") in July 2022.
The principal accounting policies and methods of computation remain unchanged from those set out in the Company's 2025 Annual Report and Accounts. The Interim Report does not include all the information required for full Financial Statements and should be read in conjunction with the Financial Statements for the year ended 28 February 2025.
Estimates
In the application of the Company's accounting policies, the Directors are required to make judgements, estimates and assumptions that affect the reported amounts of assets, liabilities, income and expenses. It is possible that actual results may differ from these estimates.
The estimates and underlying assumptions underpinning our investments are reviewed on an ongoing basis by both the Board and the Investment Manager. Revisions to any accounting estimates are recognised in the period in which the estimate is revised if the revision affects only that period, or in the period of the revision and future periods if the revision affects both current and future periods.
Going Concern
The Company's business activities, together with the factors likely to affect its future development, performance and position, are set out in the Investment Manager's Review. The Company faces a number of risks and uncertainties, as set out on pages 15 to 16.
The Company continues to meet day-to-day liquidity needs through its cash resources on hand, with a cash and cash equivalents balance of £26.6m. The Company's revenue comes predominantly from interest earned on its cash and liquid resources and to a lesser extent from the investments in Shenval (Hydroelectric power) and Modern Power Generation ("MPG"), a small lending business. The Company takes an active approach to manage liquidity and increase the return on cash held.
The major cash outflows of the Company continue to be the payment of dividends to Shareholders, costs relating to the funding of investments and investment management fees due to the Investment Manager. Dividends and new investments are discretionary and, in a time of stress, the Investment Manager may allow the Company to defer payment of management fees.
The Directors have reviewed cash flow projections which show the Company has sufficient financial resources to meet its obligations for at least 12 months from the date of this report. Accordingly, the Directors continue to adopt the going concern basis in preparing the financial statements.
3. Segmental reporting
The Directors are of the opinion that the Company only has a single operating segment of business, being investment activity.
4. Significant risk changes in the current reporting period
The Company has reviewed its exposure to climate related and other emerging business risks, but has not identified any new significant risks that could impact the financial performance or position of the Company as at 31 August 2025.
5. Investment income
|
|
|
Unaudited |
|
Audited |
|
Unaudited |
|
|
|
Six months ended 31 August 2025 |
|
Year Ended 28 February 2025 |
|
Six months ended 31 August 2024 |
|
|
|
Total |
|
Total |
|
Total |
|
|
|
£'000 |
|
£'000 |
|
£'000 |
|
|
|
|
|
|
|
|
|
Interest receivable on bank balances |
|
3 |
|
1 |
|
- |
|
Money Market funds |
|
445 |
|
1,023 |
|
542 |
|
Loan interest |
|
41 |
|
72 |
|
42 |
|
|
|
489 |
|
1,096 |
|
584 |
6. Investment management fees
|
Unaudited Six months ended 31 August 2025 |
|
Audited Year ended 28 February 2025 |
|
Unaudited Six months ended 31 August 2024 |
|
|
Revenue |
Capital |
Total |
Revenue |
Capital |
Total |
Revenue |
Capital |
Total |
|
|
£'000 |
£'000 |
£'000 |
£'000 |
£'000 |
£'000 |
£'000 |
£'000 |
£'000 |
|
Management fees |
86 |
778 |
864 |
139 |
1,250 |
1,389 |
65 |
588 |
653 |
|
Total management fees |
86 |
778 |
864 |
139 |
1,250 |
1,389 |
65 |
588 |
653 |
TPIM provides investment management services to the Company under an Investment Management Agreement dated 12 September 2023. From 12 September 2023, the Investment Manager was appointed AIFM and is responsible for risk management and portfolio management.
The Investment Manager has full discretion under the Investment Management Agreement to make investments in accordance with the Company's Investment Policy from time to time. The agreement provides for an investment management fee of 2.00% per annum of net assets, payable quarterly in arrears. The Investment Management Agreement may be terminated by either the Investment Manager or the Company by providing the other party with no less than 12 calendar months' written notice.
Performance fee
TPIM earns a performance fee if the total return (net asset value plus distributions made) to holders of the Venture Shares exceeds their net initial subscription price by an annual threshold of 3% per annum, calculated on a compound basis. To the extent that the total return exceeds the threshold over the relevant period then a performance incentive fee of 20% of the excess is payable to TPIM.
Performance fees are assessed based on the VCT's audited year-end valuations (i.e. in February each year) and will be accrued in the accounts of the Company. High water marks apply. No performance fees have been earned by TPIM in the current period or prior year.
The Investment Manager did not receive fees for services to investee companies in the current period or prior year.
7. Directors' remuneration
|
|
|
Unaudited Six months ended 31 August 2025 |
|
Audited Year ended 28 February 2025 |
|
Unaudited Six months ended 31 August 2024 |
|
|
|
Total |
|
Total |
|
Total |
|
|
|
£'000 |
|
£'000 |
|
£'000 |
|
Julian Bartlett |
|
11 |
|
22 |
|
11 |
|
Jamie Brooke |
|
13 |
|
23 |
|
11 |
|
Sam Smith* |
|
10 |
|
20 |
|
10 |
|
Jane Owen** |
|
- |
|
10 |
|
10 |
|
|
|
34 |
|
75 |
|
42 |
* Appointed as a Director effective 8 February 2024
** Resigned as a Director effective 23 July 2024
The only remuneration received by the Directors was their Directors' fees. The Company has no employees other than the Non-Executive Directors.
8. Taxation
|
|
Unaudited Six months 31 August 2025 |
Audited Year ended 28 February 2025 |
Unaudited Six months 31 August 2024 |
|
|
Total |
Total |
Total |
|
|
£'000 |
£'000 |
£'000 |
|
Profit on ordinary activities before tax |
372 |
636 |
821 |
|
Corporation tax @ 25% Effect of: |
93 |
159 |
205 |
|
Capital gains not taxable |
(290) |
(449) |
(326) |
|
Disallowed expenditure |
21 |
28 |
20 |
|
Excess management expenses on which deferred tax not recognised |
176 |
262 |
101 |
|
Tax charge for the period |
- |
- |
- |
Capital gains and losses are exempt from corporation tax due to the Company's status as a Venture Capital Trust.
9. Earnings per share
The earnings per Venture Share is 0.39p (31 August 2024: 1.17p) and is based on a profit from ordinary activities after tax of £372,000 (31 August 2024: £821,000) and on the weighted average number of Venture Shares in issue during the period of 95,269,590 (31 August 2024: 70,375,801).
10. Financial assets at fair value through profit or loss
|
|
|
Cost |
Cumulative Gains |
Fair Value |
|
|
|
£'000 |
£'000 |
£'000 |
|
Six months ended 31 August 2025: |
|
|
|
|
|
Opening cost |
|
44,791 |
- |
44,791 |
|
Opening investment holding gains |
|
- |
7,520 |
7,520 |
|
Opening value at 1 March 2025 |
|
44,791 |
7,520 |
52,311 |
|
Purchases at cost |
|
12,551 |
- |
12,551 |
|
Net gains on held investments |
|
- |
1,144 |
1,144 |
|
Closing value at 31 August 2025 |
|
57,342 |
8,664 |
66,006 |
|
|
|
Cost |
Cumulative Gains |
Fair Value |
|
|
|
£'000 |
£'000 |
£'000 |
|
Year ended 28 February 2025: |
|
|
|
|
|
Opening cost |
|
38,896 |
- |
38,896 |
|
Opening investment holding gains |
|
- |
4,928 |
4,928 |
|
Opening value at 1 March 2024 |
|
38,896 |
4,928 |
43,824 |
|
Purchases at cost |
|
9,905 |
- |
9,905 |
|
Net gains on held investments |
|
- |
1,373 |
1,373 |
|
Less: investments disposed of during the period |
|
|
|
|
|
Original cost |
|
(4,010) |
- |
(4,010) |
|
Derecognition of unrealised net cumulative losses |
|
- |
1,219 |
1,219 |
|
Closing value at 28 February 2025 |
|
44,791 |
7,520 |
52,311 |
|
|
|
Cost |
Cumulative Gains |
Fair Value |
|
|
|
£'000 |
£'000 |
£'000 |
|
Six months ended 31 August 2024: |
|
|
|
|
|
Opening cost |
|
38,896 |
- |
38,896 |
|
Opening investment holding gains |
|
- |
4,928 |
4,928 |
|
Opening value at 1 March 2024 |
|
38,896 |
4,928 |
43,824 |
|
Purchases at cost |
|
4,302 |
- |
4,302 |
|
Net gains on held investments |
|
- |
1,249 |
1,249 |
|
Less: investments disposed of during the period |
|
|
|
|
|
Original cost |
|
(915) |
- |
(915) |
|
Derecognition of unrealised net cumulative losses |
|
- |
428 |
428 |
|
Closing value at 31 August 2024 |
|
42,283 |
6,605 |
48,888 |
11. Cash and cash equivalents
|
|
31 August 2025 |
28 February 2025 |
31 August 2024 |
|
|
£'000 |
£'000 |
£'000 |
|
Cash at bank |
5,672 |
7,988 |
765 |
|
Money Market funds |
20,904 |
20,613 |
20,900 |
|
|
26,576 |
28,601 |
21,665 |
Cash and cash equivalents are short term, highly liquid investments that are readily convertible to known amounts of cash and that are subject to a lower risk of changes in value. Therefore, an investment normally qualifies as a cash equivalent only when it has a short maturity of, say, three months or less from the date of acquisition.
12. Share Capital
|
Ordinary shares of £0.01 |
|
|
|
|
Six months ended 31 August 2025
|
|
|
|
|
As at 1 March 2025 |
|
No. of Venture Shares |
Amount (£'000) |
|
|
|
87,542,533 |
875 |
|
Allotted during the period |
|
|
|
|
11 March 2025 |
|
966,588 |
10 |
|
17 March 2025 (DRIS) |
|
310,830 |
3 |
|
28 March 2025 |
|
2,702,634 |
27 |
|
3 April 2025 |
|
2,832,655 |
28 |
|
4 April 2025 |
|
1,907,382 |
19 |
|
8 April 2025 |
|
164,425 |
2 |
|
4 July 2025 |
|
1,688,981 |
17 |
|
31 July 2025 |
|
1,574,215 |
16 |
|
Shares bought back and cancelled |
|
|
|
|
11 March 2025 |
|
(389,041) |
(4) |
|
04 July 2025 |
|
(427,212) |
(4) |
|
08 August 2025 |
|
(286,072) |
(3) |
|
|
|
|
|
|
Ordinary Share Capital 31 August 2025 |
|
98,587,918 |
986 |
|
Year ended 28 February 2025
|
|
|
|
|
As at 1 March 2024 |
|
No. of Venture Shares |
Amount (£'000) |
|
|
|
63,113,620 |
631 |
|
Allotted during the period |
|
|
|
|
5 March 2024 |
|
879,639 |
9 |
|
18 March 2024 (DRIS) |
|
241,772 |
2 |
|
2 April 2024 |
|
3,769,252 |
38 |
|
4 April 2024 |
|
1,954,264 |
20 |
|
5 April 2024 |
|
1,285,315 |
13 |
|
27 June 2024 |
|
1,365,747 |
14 |
|
31 July 2024 |
|
705,100 |
7 |
|
29 October 2024 |
|
3,451,232 |
34 |
|
12 November 2024 |
|
1,818,892 |
18 |
|
2 December 2024 (DRIS) |
|
278,603 |
3 |
|
19 December 2024 |
|
3,537,826 |
35 |
|
10 February 2025 |
|
3,183,619 |
32 |
|
26 February 2025 |
|
2,465,470 |
25 |
|
Shares bought back and cancelled |
|
|
|
|
4 July 2024 |
|
(367,609) |
(4) |
|
9 August 2024 |
|
(55,800) |
(1) |
|
18 November 2024 |
|
(84,409) |
(1) |
|
Ordinary Share Capital 28 February 2025 |
|
87,542,533 |
875 |
|
Six months ended 31 August 2024
|
|
|
|
|
As at 1 March 2024 |
|
No. of Venture Shares |
Amount (£'000) |
|
|
|
63,113,620 |
631 |
|
Allotted during the period |
|
|
|
|
5 March 2024 |
|
879,639 |
9 |
|
18 March 2024 (DRIS) |
|
241,772 |
2 |
|
2 April 2024 |
|
3,769,252 |
38 |
|
4 April 2024 |
|
1,954,264 |
20 |
|
5 April 2024 |
|
1,285,315 |
13 |
|
27 June 2024 |
|
1,365,747 |
14 |
|
31 July 2024 |
|
705,100 |
7 |
|
Shares bought back and cancelled |
|
|
|
|
4 July 2024 |
|
(367,609) |
(4) |
|
9 August 2024 |
|
(55,800) |
(1) |
|
Ordinary Share Capital 31 August 2024 |
|
72,891,300 |
729 |
13. Dividends
|
|
Six Months ended 31 August 2025 |
Year ended 28 February 2025 |
Six Months ended 31 August 2024 |
|
|
£'000 |
£'000 |
£'000 |
|
Venture Share Dividend 2.00p per share (Period ended 31 August 2025 2.00p) |
1,751 |
- |
- |
|
Venture Share Dividend 2.00p per share (Year ended 28 February 2025 2.00p) |
- |
1,262 |
1,262 |
|
Venture Share Dividend 2.00p per share (Year ended 28 February 2025: 2.00p) |
- |
1,563 |
- |
|
Total Dividend Paid |
1,751 |
2,825 |
1,262 |
The Board announced an interim dividend of 2 pence per share, equivalent to £2 million, to Shareholders on 29 September 2025. The dividend is due to be paid on or around 1 December 2025 to Shareholders on the register at the close of business on 14 November 2025, and as a result is not included in the table above.
14. Net asset value per share
|
|
Six months ended 31 August 2025 |
Year ended 28 February 2025 |
Six months ended 31 August 2024 |
|
Net asset value per Venture Share (p) |
93.94 |
95.44 |
97.61 |
The net asset value per Venture Share is 93.94p (28 February 2025: 95.44p) and is calculated on net assets of £92.6 million divided by the 98,587,918 Venture Shares in issue as at 31 August 2025.
15. Ongoing Charges Ratio (annualised)
|
|
Six months to 31 August 2025 |
|
Year to 28 February 2025 |
|
Six months to 31 August 2024 |
|
|
£'000 |
|
£'000 |
|
£'000 |
|
Management fees |
864 |
|
1,389 |
|
653 |
|
Other operating expenses |
413 |
|
870 |
|
413 |
|
Less: Non-recurring legal & professional fees |
(51) |
|
(113) |
|
(80) |
|
Total ongoing charges |
1,226 |
|
2,146 |
|
986 |
|
|
|
|
|
|
|
|
Average undiluted net assets* |
82,673 |
|
72,121 |
|
62,150 |
|
Ongoing Charges ratio (annualised) |
2.97% |
|
2.98% |
|
3.17% |
The annualised ongoing charges represent the total expense for the year with the exclusion of performance fees payable by Triple Point Investment Management LLP and certain non-recurring expenses, calculated using to AIC guidance from the Association of Investment Companies. TPV's annual running costs will continue to be capped at 3.5% of TPV's NAV (excluding VAT and also any performance fees payable to TPIM). Any excess will be met by TPIM by way of a reduction in future investment management fees.
*Average net assets is calculated from overall average of quarterly net asset value.
16. Related party transactions
There were no related party transactions during the period as defined in International Accounting Standards.
17. Post balance sheet events
The following events occurred between the balance sheet date and the signing of this interim report:
The Company has made one investment since the period end:
· £1.0 million new investment into Chalkie AI Limited
Shareholder Information
|
Directors
Julian Bartlett Jamie Brooke Sam Smith
|
Solicitors
Howard Kennedy LLP No. 1 London Bridge London SE1 9BG
|
|
Administrator, Company Secretary and Registered Office
JTC (UK) Limited The Scalpel 18th Floor 52 Lime Street London EC3M 7AF
|
Registrars
Computershare Investor Services plc The Pavilions Bridgwater Road Bristol BS99 6ZY
|
|
Registered Number
07324448
|
VCT Taxation Advisers
Philip Hare & Associates LLP 6 Snow Hill London EC1A 2AY
|
|
Investment Manager and AIFM
Triple Point Investment Management LLP 1 King William Street London EC4N 7AF
Tel: 020 7201 8989
|
Bankers
The Royal Bank of Scotland plc 54 Lime Street London EC3M 7NQ
|
|
Independent Auditor
Deloitte LLP The Silver Fin Building 8th Floor 455 Union Street Aberdeen AB11 6DB
|
Depositary
Indos Financial Limited The Scalpel 18th Floor 52 Lime Street London EC3M 7AF
|
[1] Source: Pitchbook-NVCA Venture Monitor (April 2025)
[2] Source: Beauhurst (2025).
RNS may use your IP address to confirm compliance with the terms and conditions, to analyse how you engage with the information contained in this communication, and to share such analysis on an anonymised basis with others as part of our commercial services. For further information about how RNS and the London Stock Exchange use the personal data you provide us, please see our Privacy Policy.