
("Artemis" or the "Company")
Annual Report for Year Ended 30
The Directors of
An extract of the audited results is included in the announcement below and the full Annual Report is available on the Company's website at https://artemisresources.com.au/.
This announcement was approved for release by the Board.
|
|
|
|
|
|
|
Zeus (Nomad & Broker) |
|
|
|
Tel: +44 20 3829 5000 |
CHAIRMAN'S LETTER
Dear fellow Shareholders,
On behalf of the Directors of
FY2025 saw significant on-field exploration as we expanded the footprint of the Carlow mineralisation. Surface sampling at Titan and Thorpe prospects yielded exceptional gold and copper assays. These results were followed up with a Phase One drilling programme, targeting Marillion,
Encouraged by these results we will in Q2 FY2026 undertake diamond drilling to scope out potential for significant extensions to the Carlow Mineral Resource which contains 374koz gold and 64,000t copper. At Titan we have commenced shallow low-cost RC drilling of geophysical anomalies in areas with high-grade surface gold occurrences and a brecciated host sequence near previous gold mineralisation encountered in the Phase One programme.
In addition to the
With the
In
To our shareholders, including existing and new shareholders who supported the capital raises in February and
Mr
Executive Chairman
OPERATING AND FINANCIAL REVIEW
REVIEW OF OPERATIONS
The primary focus during the year was on gold exploration, notably on the 100% Carlow Tenement (E 47/1797-1). In addition, Artemis consolidated a substantial tenement holding at the
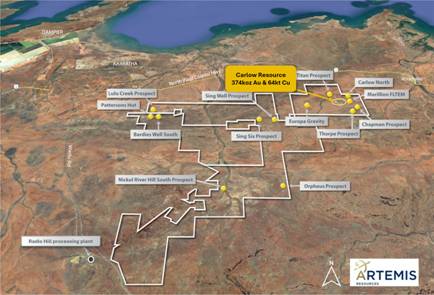
Figure 1.
Carlow Tenement
Exploration activities during the year within the Carlow Tenement consisted of detailed geological and structural mapping, geophysical interpretations and selective rock chip sampling of surface quartz veins and chert outcrops at the Titan Prospect in the central part of the Carlow Tenement.
This was followed by a diamond drilling program in February and
Interpretations of the Carlow tenement which combine outcrop mapping, gravity date, key structural elements and the location of high-grade surface gold results announced in 2024 from selected rock chip sampling of outcrops are shown in Figures 2 and 3. (Note: a list of Artemis ASX announcements relating to rock chip samples referred to in this report is listed in the report).
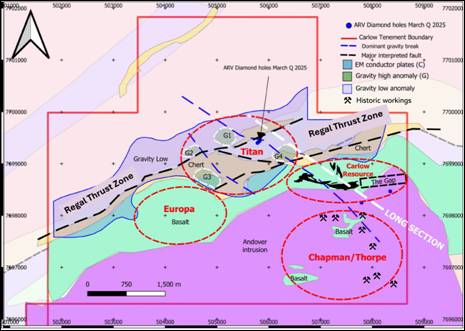
Figure 2. Simplified geological and structural interpretation of Carlow Tenement showing the outline of Carlow resource model, three priority satellite targets and four gravity anomalies (G1-G4) within the Titan with prospect area. The long section is shown in Figure 4 in this report.
Figure 3. Gravity image of Carlow Tenement showing gravity-low feature at Titan with selected gold assays from surface rock chip samples. Shows outline of the Carlow resource model within an interpreted 4km long northwest trending prospective zone, in red dash outline.
In addition to the drilling program during the
This review concluded that potential high grade strike extensions to the Carlow deposit may exist in the undrilled area (the 'Gap') extending >600m between the eastern end of the Carlow resource and hole 25ARDD001 which intersected 7m @ 2.9g/t Au (Refer to Figure 4).
The review also highlighted the potential for extensions below the resource which is based on drilling down to 380m vertical depth. Only one historic diamond hole (20CCDD003) has tested below the resource, intersecting 4m @ 11.1g/t Au and 2.01% Cu above the interpreted contact of the Regal Thrust (Refer to Figure 4). The potential for resource extensions below the resource and above the interpreted Regal Thrust may extend >1km and is effectively untested.
Figure 4. Schematic long section through Carlow Resource and Titan East showing the location of hole 25ARDD001 and revised the geological model for the area
Following the diamond drilling program in the Carlow-Titan area a revised geological and structural interpretation was prepared and is summarised on Figure 3. The main conclusions are:
Andover Intrusion previously interpreted to cut off the eastern end of the Carlow resource is now interpreted as a flat lying sill overlying the Carlow basalt hosting gold and copper
Regal Thrust which outcrops as a steep dipping chert ridge north and east of Carlow and regarded as the gold conduit now interpreted as a shallow dipping thrust below Carlow
Three holes at Titan East intersected elevated gold (peak 1m @ at 16.4g/t Au) within chrome rich ultramafics overlying a previously unrecognised sequence of altered sediments
On
Andover Lithium is the largest lithium exploration tenement package in the West Pilbara covering over 420 km2 along strike from the
Consolidation of the extensive lithium interests of GreenTech and Artemis provides an opportunity to attract a major funding partner into the Andover Lithium JV and will allow the two companies to focus on their core exploration and resource expansion activities in the Karratha region, respectively for copper/zinc and gold.
Despite current lithium market sentiment, GreenTech and Artemis believe the lithium prospectivity of their combined tenements remains compelling. The combined tenements contain undrilled outcropping lithium bearing pegmatites within the same corridor which hosts the Tier 1 lithium pegmatite project discovered by
 |
Figure 5: Andover Lithium Joint Venture Tenements
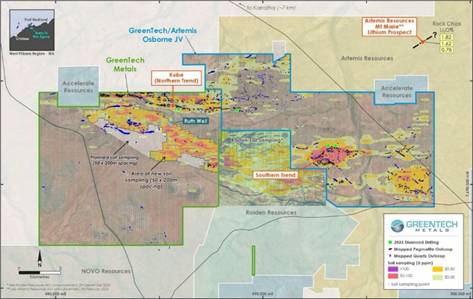
Figure 6. Osborne tenement within Andover Lithium JV showing mapped pegmatites and lithium soil anomalies
A strategic review of the Company's 100% owned
While the
As part of this strategy, Artemis's subsidiary (
The Cassowary Intrusion occurs in a rare geological setting, being located on the margin of a wide, >400km long northeast trending crustal boundary (Madura West Crustal Boundary) where the surrounding geological formations are interpreted to be disrupted for kilometres by the intrusion. There is no known drilling at Cassowary.
Exploration will test the potential for IOCG type copper/gold mineralisation which may be associated with the intrusion. A high-resolution gravity survey is planned to assist drill targeting.
The Madura West Crustal Boundary has attracted major companies: BHP Nickel West previously explored for nickel, global copper producer Teck (
Figure 7. Magnetic image with Artemis granted exploration licence (E69/4266) in yellow covering interpreted Cassowary Intrusion.
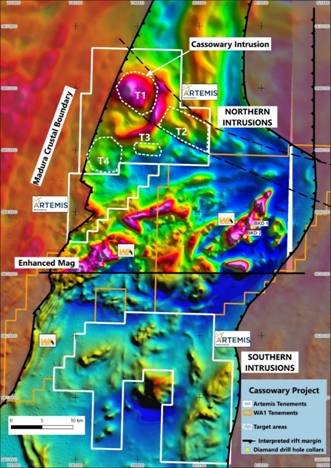
Figure 8: Magnetic image[2] showing Madura Crustal Boundary, interpreted rift zone, Artemis and WA1 Resources tenements and priority targets within the area of Northern Intrusions. Source: TMI image from Geoscience Australia survey P1208 (
Artemis ASX announcements relating to surface rock chip results from the
High grade rock chip gold assays,
High grade gold vein discovery at Titan prospect,
High grade gold vein discovery at Titan prospect amended,
Titan prospect results - clarification statement,
Titan delivers further high-grade rock chip results,
New Regional Discovery High-
Caution regarding Forward Looking Information
This document contains forward looking statements concerning
COMPETENT PERSONS' STATEMENT
The information in this report that relates to exploration results is based on and fairly represents information supporting documentation prepared by Mr
TRADITIONAL OWNERS
Artemis would not be able to operate successfully without the support of the Traditional Owners and the local communities in which we operate. We continue to build trust and respect between Artemis and our key stakeholders through transparency, listening, acting on concerns, and looking for innovative and sustainable ways of ensuring that the Traditional Owners are participating in the journey to explore and develop, responsibly and sensitively. We are working closely with our Native Title holders to identify mutually supportive initiatives which will see a growing range of business and employment opportunities being developed and importantly ensuring that the local community has the capability and opportunity to grow with the Company.
FINANCIAL RESULTS AND CONDITION
The loss for the financial year ended
On
The Group has a working capital surplus of
Subsequent to year end, the Company completed two capital raisings totalling
BOARD CHANGES
On
In addition, the Board appointed two non-executive directors:
OPERATING AND FINANCIAL RISK
The Company's activities have inherent risk, and the Board is unable to provide certainty of the expected results of activities, or that any or all the likely activities will be achieved. The material business risks faced by the Group that could influence the Group's prospects, and how the Group manages these risks, are detailed below:
Operational risks
The Company may be affected by various operational factors. If any of these potential risks eventuate, the Company's operational and financial performance may be adversely affected. No assurances can be given that the Company will achieve commercial viability through the successful exploration and/or mining of its tenement interests. Until the Company can realise value from its projects, it is likely to incur ongoing operating losses.
The operations of the Company may be affected by various factors, including failure to locate or identify mineral deposits, failure to achieve predicted grades in exploration and mining, operational and technical difficulties encountered in mining, insufficient or unreliable infrastructure such as power, water and transport, difficulties in commissioning and operating plant and equipment, unanticipated metallurgical problems which may affect extraction costs, adverse weather conditions, industrial and environmental accidents, industrial disputes and unexpected shortages or increases in the costs of consumables, spare parts, plant and equipment.
The Company's Mineral Resource estimates are made in accordance with the 2012 edition of the JORC Code. Mineral resources are estimates only. An estimate is an expression of judgement based on knowledge, experience and industry practice. Estimates which were valid when originally calculated may alter significantly when new information or techniques become available. In addition, by their very nature, resource estimates are imprecise and depend to some extent on interpretations, which may prove to be inaccurate.
The tenements are at various stages of exploration, and potential investors should understand that mineral exploration and development are speculative and high-risk undertakings that may be impeded by circumstances and factors beyond the control of the Company.
There can be no assurance that exploration of the tenements, or any other exploration properties that may be acquired in the future, will result in the discovery of an economic mineral resource. Even if an apparently viable deposit is identified, there is no guarantee that it can be economically exploited.
Further capital requirements
The Company's projects may require additional funding to progress activities. There can be no assurance that additional capital or other types of financing will be available if needed to further exploration or possible development activities and operations or that, if available, the terms of such financing will be favourable to the Company.
Native title and Aboriginal Heritage
There are areas of the Company's projects over which legitimate common law and/or statutory Native Title rights of Aboriginal Australians exist. Where Native Title rights do exist, the Company must obtain consent of the relevant landowner to progress the exploration, development and mining phases of operations. Where there is an Aboriginal Site for the purposes of the Aboriginal Heritage legislation, the Company must obtain consents in accordance with the legislation.
The Company's activities are subject to Government regulations and approvals
The Company is subject to certain Government regulations and approvals. Any material adverse change in government policies or legislation in Western Australian and
Global conditions
General economic conditions may also affect the value of the Company and its market valuation regardless of its actual performance.
Schedule of tenement holdings at end of Q4 CY2025. All are in
|
Tenement |
Project |
Holder |
Holding |
Status |
|
E47/1797 |
Greater Carlow |
|
100% |
Live |
|
E47/1746 |
Cherratta |
|
100% |
Live |
|
E47/3719 |
Osbourne |
|
49% |
Live |
|
P47/1972 |
Cherratta |
|
100% |
Live |
|
M47/337 |
Radio Hill |
|
100% |
Live |
|
M47/161 |
Radio Hill |
|
100% |
Live |
|
E47/3361 |
Radio Hill |
|
100% |
Live |
|
L47/93 |
Radio Hill |
|
100% |
Live |
|
E45/5276 |
Central Paterson |
Elysian Resources Pty Ltd |
100% |
Live |
|
E69/4266 |
|
|
100% |
Pending |
|
E69/4317 |
|
|
100% |
Pending |
|
E69/4318 |
|
|
100% |
Pending |
Carlow mineral resource estimate - Refer to Artemis ASX announcement 13 October 2022.
GENERAL INFORMATION
The consolidated financial statements cover
|
Registered office Level 2, 10 West Perth WA 6005
|
A description of the nature of the Group's operations and its principal activities is included in the Directors' Report, which is not part of the financial statements.
The financial statements were authorised for issued, in accordance with a resolution of directors, on 26 September 2025. The directors have the power to amend and reissue the financial statements.
CONSOLIDATED STATEMENT OF PROFIT OR LOSS AND OTHER COMPREHENSIVE INCOME
For the year ended 30 June 2025
|
|
|
|
|
|
|
|
|
|
|
Other income |
4 |
327,679 |
232,740 |
|
Finance income |
5 |
14,996 |
7,638 |
|
Gain on contribution of exploration assets |
16 |
351,037 |
- |
|
Exploration expenditure written off |
13 |
(4,245,026) |
(55,572) |
|
Exploration expenditure expensed through profit or loss |
|
(77,941) |
- |
|
Impairment of development assets |
|
- |
(12,128,289) |
|
Marketing and business development costs |
|
(212,030) |
(483,090) |
|
Personnel expenses |
6 |
(806,018) |
(579,768) |
|
Professional fees |
|
(558,119) |
(425,161) |
|
Statutory fees |
|
(111,474) |
(163,197) |
|
Occupancy costs |
|
(45,947) |
(29,359) |
|
Travel expenses |
|
(40,545) |
(47,695) |
|
Other general and administration expenses |
|
(40,882) |
(215,037) |
|
Net fair value loss on revaluation of financial assets |
12 |
(761,531) |
(2,666,250) |
|
Depreciation expense |
|
(28,056) |
(35,406) |
|
Amortisation expense |
|
(66,141) |
- |
|
Other losses |
7 |
(22,673) |
(3,323) |
|
Finance costs |
5 |
(6,642) |
- |
|
Loss before income tax |
|
(6,329,313) |
(16,591,769) |
|
|
|
|
|
|
Income tax expense |
9 |
- |
- |
|
Loss for the year |
|
(6,329,313) |
(16,591,769) |
|
|
|
|
|
|
Other comprehensive loss, net of tax |
|
- |
- |
|
Total comprehensive loss for the year |
|
(6,329,313) |
(16,591,769) |
|
|
|
|
|
|
Total comprehensive loss attributable to owners of the Company |
|
(6,329,313) |
(16,591,769) |
|
|
|
|
|
|
Loss per share (cents per share) |
|
|
|
|
Basic and diluted |
8 |
(0.29) |
(1.00) |
|
|
|
|
|
|
|
|
|
|
The above consolidated statement of profit or loss and other comprehensive income should be read in conjunction with the accompanying notes.
CONSOLIDATED STATEMENT OF FINANCIAL POSITION
As at 30 June 2025
|
|
|
|
|
|
|
|
|
|
|
|
|
|
|
|
|
|
|
Assets |
|
|
|
|
|
Cash and cash equivalents |
10(a) |
1,153,986 |
572,628 |
|
|
Trade and other receivables |
11 |
117,369 |
46,177 |
|
|
Other financial assets |
12 |
468,469 |
1,080,000 |
|
|
Prepayments |
|
44,892 |
88,221 |
|
|
Total current assets |
|
1,784,716 |
1,787,026 |
|
|
|
|
|
|
|
|
Capitalised exploration and evaluation |
13 |
31,915,047 |
34,213,548 |
|
|
Development expenditure |
14 |
509,950 |
3,042,873 |
|
|
Investment in incorporated joint venture |
16 |
1,850,000 |
- |
|
|
Property, plant, and equipment |
15 |
67,541 |
34,335 |
|
|
Right-of-use assets |
17 |
160,616 |
44,999 |
|
|
Term deposit |
12 |
42,290 |
42,290 |
|
|
Total non-current assets |
|
34,545,444 |
37,378,045 |
|
|
Total assets |
|
36,330,160 |
39,165,071 |
|
|
|
|
|
|
|
|
Liabilities |
|
|
|
|
|
Trade and other payables |
18 |
1,212,435 |
1,335,006 |
|
|
Right-of-use lease liabilities |
20 |
113,894 |
47,792 |
|
|
Employee benefits |
6 |
23,728 |
27,569 |
|
|
Total current liabilities |
|
1,350,057 |
1,410,367 |
|
|
|
|
|
|
|
|
Provisions |
19 |
3,459,773 |
5,923,259 |
|
|
Right-of-use lease liabilities |
20 |
49,505 |
- |
|
|
Total non-current liabilities |
|
3,509,278 |
5,923,259 |
|
|
Total liabilities |
|
4,859,335 |
7,333,626 |
|
|
Net assets |
|
31,470,825 |
31,831,445 |
|
|
|
|
|
|
|
The above consolidated statement of financial position should be read in conjunction with the accompanying notes.
CONSOLIDATED STATEMENT OF FINANCIAL POSITION (continued)
As at 30 June 2025
|
|
|
|
|
|
|
|
|
|
|
|
|
|
|
|
|
|
|
Equity |
|
|
|
|
|
Share capital |
21 |
125,661,826 |
120,237,759 |
|
|
Reserves |
22 |
962,137 |
499,111 |
|
|
Accumulated losses |
|
(95,153,138) |
(88,905,425) |
|
|
Total equity attributable to equity holders of the Company |
|
31,470,825 |
31,831,445 |
|
|
|
|
|
|
|
The above consolidated statement of financial position should be read in conjunction with the accompanying notes.
CONSOLIDATED STATEMENT OF CHANGES IN EQUITY
For the year ended 30 June 2025
|
|
|
|
|
|
|
|
|
|
|
|
|
|
|
Balance on 1 July 2023 |
117,396,554 |
389,358 |
- |
(72,420,854) |
45,365,058 |
|
|
|
|
|
|
|
|
Loss after income tax expense for the year |
- |
- |
|
(16,591,769) |
(16,591,769) |
|
Total comprehensive loss for the year |
- |
- |
|
(16,591,769) |
(16,591,769) |
|
|
|
|
|
|
|
|
Transactions with owners in their capacity as owners |
|
|
|
|
|
|
Contributions of equity, net of transaction costs (note 21) |
2,988,152 |
- |
- |
- |
2,988,152 |
|
Transfer to accumulated losses on expiry of options |
- |
(107,198) |
- |
107,198 |
- |
|
Share-based payments (note 22) |
(146,947) |
216,951 |
- |
- |
70,004 |
|
Balance on 30 June 2024 |
120,237,759 |
499,111 |
- |
(88,905,425) |
31,831,445 |
|
|
|
|
|
|
|
|
Balance on 1 July 2024 |
120,237,759 |
499,111 |
- |
(88,905,425) |
31,831,445 |
|
|
|
|
|
|
|
|
Loss after income tax expense for the year |
- |
- |
- |
(6,329,313) |
(6,329,313) |
|
Total comprehensive loss for the year |
- |
- |
- |
(6,329,313) |
(6,329,313) |
|
|
|
|
|
|
|
|
Transactions with owners in their capacity as owners |
|
|
|
|
|
|
Contributions of equity, net of transaction costs (note 21) |
5,424,067 |
- |
- |
- |
5,424,067 |
|
Transfer to accumulated losses on expiry of options |
- |
(81,600) |
|
81,600 |
- |
|
Share-based payments (note 22) |
- |
526,256 |
18,370 |
- |
544,626 |
|
Balance on 30 June 2025 |
125,661,826 |
943,767 |
18,370 |
(95,153,138) |
31,470,825 |
|
|
|
|
|
|
|
The above consolidated statement of changes in equity should be read in conjunction with the accompanying notes.
CONSOLIDATED STATEMENT OF CASH FLOWS
For the year ended 30 June 2025
|
|
|
|
|
|
|
|
|
|
|
Cash flows from operating activities |
|
|
|
|
Receipts from customers |
|
275,647 |
- |
|
Receipts from joint venture partners |
|
77,025 |
232,740 |
|
Cash paid to suppliers and employers |
|
(1,988,889) |
(2,045,331) |
|
Interest received |
|
14,996 |
7,639 |
|
Interest paid |
|
(6,642) |
(4,757) |
|
Payments for exploration and evaluation |
|
(78,188) |
- |
|
Net cash used in operating activities |
10(b) |
(1,706,051) |
(1,809,709) |
|
|
|
|
|
|
Cash flows from investing activities |
|
|
|
|
Payments for financial assets at fair value through profit or loss |
12 |
(150,000) |
- |
|
Payments for capitalised exploration |
13 |
(2,685,275) |
(2,453,488) |
|
Net cash used in investing activities |
|
(2,835,275) |
(2,453,488) |
|
|
|
|
|
|
Cash flows from financing activities |
|
|
|
|
Proceeds from issue of shares |
21 |
5,687,491 |
3,429,683 |
|
Repayment of right-of-use lease liability |
17 |
(111,150) |
(109,924) |
|
Payment of capital raising costs |
|
(453,657) |
(185,097) |
|
Net cash from financing activities |
|
5,122,684 |
3,134,662 |
|
Net increase / (decrease) in cash and cash equivalents |
|
581,358 |
(1,128,535) |
|
Effects of exchange rate fluctuations on cash held |
|
- |
(1,853) |
|
Cash and cash equivalents on 1 July |
|
572,628 |
1,703,016 |
|
Cash and cash equivalents on 30 June |
10(a) |
1,153,986 |
572,628 |
|
|
|
|
|
The above consolidated statement of cash flows should be read in conjunction with the accompanying notes.
NOTES TO THE CONSOLIDATED FINANCIAL REPORT
For the year ended 30 June 2025
1 MATERIAL ACCOUNTING POLICIES
The principal accounting policies adopted in the preparation of the financial statements are set out below. These policies have been consistently applied to all the years presented, unless otherwise stated.
1.1 NEW OR AMENDED ACCOUNTING STANDARDS AND INTERPRETATIONS ADOPTED
The Group has adopted all the new or amended Accounting Standards and Interpretations issued by the Australian Accounting Standards Board ("AASB") that are mandatory for the current reporting period.
Australian Accounting Standards and Interpretations that have recently been issued or amended but are not yet mandatory, have not been early adopted by the Group for the annual reporting period ended 30 June 2025. The Group has not yet assessed the impact of these new or amended Accounting Standards and Interpretations.
1.2 BASIS OF PREPARATION
These general-purpose financial statements have been prepared in accordance with Australian Accounting Standards and Interpretations issued by the Australian Accounting Standards Board ("AASB") and the Corporations Act 2001, as appropriate for, for-profit oriented entities. These financial statements also comply with International Financial Reporting Standards as issued by the
Historical cost convention
The financial statements have been prepared under the historical cost convention, except for, where applicable, the revaluation of financial assets and liabilities at fair value through profit or loss, financial assets at fair value through other comprehensive income, certain classes of property, plant, and equipment and derivative financial instruments.
Critical accounting estimates
The preparation of the financial statements requires the use of certain accounting estimates. It also requires management to exercise its judgement in the process of applying the Group's accounting policies. The areas involving a higher degree of judgement or complexity, or areas where assumptions and estimates are significant to the financial statements, are disclosed in note 2.
1.3 PARENT ENTITY INFORMATION
In accordance with the Corporations Act 2001, these financial statements present the results of the Group only. Supplementary information about the parent entity is disclosed in note 27.
1.4 PRINCIPLES OF CONSOLIDATION
The consolidated financial statements incorporate the assets and liabilities of all subsidiaries of
Subsidiaries are all those entities over which the Group has control. The Group controls an entity when the Group is exposed to, or has rights to, variable returns from its involvement with the entity and can affect those returns through its power to direct the activities of the entity. Subsidiaries are fully consolidated from the date on which control is transferred to the Group. They are de-consolidated from the date that control ceases.
Intercompany transactions, balances, and unrealised gains on transactions between entities in the Group are eliminated. Unrealised losses are also eliminated unless the transaction provides evidence of the impairment of the asset transferred. Accounting policies of subsidiaries have been changed where necessary to ensure consistency with the policies adopted by the Group.
The acquisition of subsidiaries is accounted for using the acquisition method of accounting. A change in ownership interest, without the loss of control, is accounted for as an equity transaction, where the difference between the consideration transferred and the book value of the share of the non-controlling interest acquired, is recognised directly in equity attributable to the parent.
Non-controlling interest in the results and equity of subsidiaries are shown separately in the statement of profit or loss and other comprehensive income, statement of financial position, and statement of changes in equity of the Group. Losses incurred by the Group are attributed to the non-controlling interest in full, even if that results in a deficit balance.
When the Group loses control over a subsidiary, it derecognises the assets including goodwill, liabilities, and non-controlling interest in the subsidiary together with any cumulative translation differences recognised in equity. The Group recognises the fair value of the consideration received and the fair value of any investment retained together with any gain or loss in profit or loss.
1.5 CURRENT AND NON-CURRENT CLASSIFICATION
Assets and liabilities are presented in the statement of financial position based on current and non-current classification.
An asset is classified as current when it is either expected to be realised or intended to be sold or consumed in the Group's normal operating cycle, it is held primarily for the purpose of trading, it is expected to be realised within 12 months after the reporting date, or the asset is cash or cash equivalent unless restricted from being exchanged or used to settle a liability for at least 12 months after the reporting date. All other assets are classified as non-current.
A liability is classified as current when it is either expected to be settled in the Group's normal operating cycle, it is held primarily for the purpose of trading, it is due to be settle within 12 months after the reporting date, or there is no unconditional right to defer the settlement of the liability for at least 12 months after the reporting date. All other liabilities are classified as non-current.
Deferred tax assets and liabilities are always classified as non-current.
1.6 GOING CONCERN
The consolidated financial statements have been prepared on a going concern basis which contemplates continuity of normal business activities and realisation of assets and settlement of liabilities in the normal course of business. For the year ended 30 June 2025, the Group incurred an operating loss of $6,329,313 and had net cash outflows from operating activities of $1,706,051. On 30 June 2025, the Group had net assets of $31,470,825, with total cash on hand of $1,153,986.
The directors believe that it is reasonably foreseeable that the Company and Group will continue as a going concern and that it is appropriate to adopt the going concern basis in the preparation of the financial report after consideration of the following factors:
· The Company has raised $5,705,198 before costs, in new capital during the year
· Directors are of the view that should the Company require additional capital, it can raise further capital to enable the Group to meet schedule exploration expenditure requirements
· The ability of the Group to scale back certain parts of its activities that are non-essential to conserve cash; and
· The Group retains the ability, if required, to wholly or in part dispose of interests in mineral exploration and assets.
Subsequent to year end, the Company completed a further capital raise totalling $4,925,000 before costs. These funds are expected to support the Company's planned exploration and working capital requirements in the medium term. However, should the Company be unable to secure additional capital in a sufficiently timely manner and/or reduce its expenditure profile, a material uncertainty remains that may cast significant doubt as to whether the Company and Group will continue as a going concern and therefore whether they will realise their assets and extinguish their liabilities in the normal course of business and at the amounts stated in the financial report.
2 CRITICAL ACCOUNTING JUDGEMENTS, ESTIMATES AND ASSUMPTIONS
The preparation of the financial statements requires management to make judgements, estimates and assumptions that affect the reported amounts in the financial statements. Management continually evaluates its judgements and estimates in relation to assets, liabilities, revenue, and expenses. Management bases its judgements, estimates and assumptions on historical experience and on other various factors, including expectations of future events, management believes to be reasonable under the circumstances. The resulting accounting judgements and estimates will seldom equal the related actual results. Judgements estimates and assumptions that have a significant risk of causing a material adjustment to the carrying amounts of assets and liabilities (refer to the respective notes) within the next financial year are discussed below.
Exploration and evaluation, and development expenditure carried forward
The Group capitalises expenditure relating to exploration and evaluation, and development, where it is considered likely to be recoverable or where the activities have not reached a stage which permits a reasonable assessment of the existence of reserves. While there are certain areas of interest from which no reserves have been determined, the Directors are of the continued belief that such expenditure should not be written off since feasibility studies in such areas have not yet concluded.
2 CRITICAL ACCOUNTING JUDGEMENTS, ESTIMATES AND ASSUMPTIONS (continued)
Exploration and evaluation, and development expenditure carried forward (continued)
The recoverability of the carrying amount of mine development expenditure carried forward has been reviewed by the Directors. In conducting the review, the recoverable amount has been assessed by reference to the higher of "fair value less costs of disposal" and "value in use". In determining value in use, future cash flows are based on:
· Estimates of ore reserves and mineral resources for which there is a high degree of confidence of economic extraction
· Estimate production and sales levels
· Estimated future commodity prices
· Future costs of production
· Future capital expenditure and/or
· Future exchange rates
Variations to expected future cash flows, and timing thereof, could result in significant changes to the impairment test results, which in turn could impact future financial results.
The fair value less costs of disposal was estimated by an independent valuation expert using the 'cost approach'. The cost approach is based on the proposition that an informed purchaser would pay no more for an asset than the cost of providing a substitute with the utility as the subject asset. Direct and indirect comparisons with sales prices considering the age and condition of the asset is used to estimate the fair value of the asset. The fair value is a level 3 input on the fair value hierarchy. Refer to note 14.
Site rehabilitation
The provision for site rehabilitation requires significant judgement in estimating the timing and cost of future restoration activities. These estimates include assumptions about discount rates, inflation, the expected life and the extent of work required, all of which may change as circumstances evolve.
During the year, management engaged an independent expert to reassess the rehabilitation provision. Based on this review, the provision has been updated to reflect revised cost estimates and current market assumptions. The reassessment incorporated a discount rate of 4.21% and an inflation assumption of 2.1%. Changes in these assumptions could result in material adjustments to the provision. For example, a 1% change in the discount rate would change the provision by approximately $300,000. Refer to note 19.
Depreciation
Judgement is applied in determining the useful lives and residual values of property, plant and equipment. Estimates are based on expected usage, technological developments and future economic benefits. Changes in these assumptions may result in material adjustments to depreciation expense. Refer to note 15.
Share-based payment transactions
The Group measures the cost of equity-settled transactions with employees by reference to the fair value of the equity instruments at the date at which they are granted. The fair value is determined using a Black-Scholes model, using the assumptions detailed in note 22.
2 CRITICAL ACCOUNTING JUDGEMENTS, ESTIMATES AND ASSUMPTIONS (continued)
Fair value of financial instruments
Management uses valuation techniques to determine the fair value of financial instruments (where active market quotes are not available) and non-financial assets. This involves developing estimates and assumptions consistent with how market participants would price the instrument.
Management bases its assumption on observable data as far as possible, but this is not always available. In that case, management uses the best information available. Estimated fair values may vary from the actual prices that would be achieved in an arm's length transaction at the reporting date. Refer note 23.
3 OPERATING SEGMENTS
Accounting Policy
|
Operating segments are presented using the 'management approach', where the information presented is on the same basis as the internal reports provided to the Chief Operating Decision Makers ('CODM'). The CODM, who is responsible for allocating resources and assessing performance of the operating segments, has been identified as the Board of Directors of
|
For management purposes, the Group is organised into two operating segments based on the operations each performs, being:
· Mineral exploration
· Development
The Board (who is identified as the CODM) monitors the Group based on actual versus budgeted expenditure incurred by area of interest.
The internal reporting framework is the most relevant to assist the Board with making decisions regarding the Group and its ongoing exploration activities.
During the year, the Group established an incorporated joint venture to explore for lithium. As the joint venture has not yet commenced operations, it does not constitute a separate operating segment. The Group's interest is accounted for using the equity method (refer to note 16).
There have been no other changes to the basis of segmentation or the measurement basis for the segment profit or loss since 30 June 2024.
3 OPERATING SEGMENTS (continued)
Segment information provided to the Board:
|
|
|
|
|
|
||
|
|
|
|
|
|
|
|
|
30 June 2025 |
|
|
|
|
|
|
|
Segment revenue |
- |
- |
- |
- |
327,679 |
327,679 |
|
Fair value loss on financial assets |
- |
- |
- |
- |
(761,531) |
(761,531) |
|
Gain on contribution of exploration assets |
351,037 |
- |
- |
- |
- |
351,037 |
|
Segment expenses |
(102,877) |
- |
- |
- |
(1,898,595) |
(2,001,472) |
|
Project and exploration expenditure write off |
(903,531) |
(3,341,495) |
- |
- |
- |
(4,245,026) |
|
Reportable segment loss |
(655,371) |
(3,341,495) |
- |
- |
(2,332,447) |
(6,329,313) |
|
|
|
|
|
|
|
|
|
Reportable segment assets |
26,994,563 |
- |
1,850,000 |
5,567,751 |
1,917,846 |
36,330,160 |
|
Reportable segment liabilities |
(408,460) |
- |
- |
(3,459,773) |
(991,102) |
(4,859,335) |
|
Additions to non-current assets |
3,445,488 |
- |
1,850,000 |
- |
227,437 |
5,522,925 |
|
|
|
|
|
|
|
|
|
30 June 2024 |
|
|
|
|
|
|
|
Segment revenue |
- |
- |
- |
- |
240,378 |
240,378 |
|
Fair value loss on financial assets |
- |
- |
- |
- |
(2,666,250) |
(2,666,250) |
|
Segment expenses |
- |
- |
- |
- |
(1,982,036) |
(1,982,036) |
|
Impairment |
- |
- |
- |
(12,128,289) |
- |
(12,128,289) |
|
Project and exploration expenditure write off |
(55,572) |
- |
- |
- |
- |
(55,572) |
|
Reportable segment loss |
(55,572) |
- |
- |
(12,128,289) |
(4,407,908) |
(16,591,769) |
|
|
|
|
|
|
|
|
|
Reportable segment assets |
25,223,384 |
8,314,519 |
675,645 |
3,042,873 |
1,908,650 |
39,165,071 |
|
Reportable segment liabilities |
- |
- |
- |
5,923,259 |
1,410,366 |
7,333,626 |
|
Additions to non-current assets |
1,653,912 |
350,825 |
209,674 |
221,097 |
- |
2,435,508 |
3 OPERATING SEGMENTS (continued)
For monitoring segment performance and allocating resources between segments:
· All assets are allocated to reportable segments, other than corporate office assets, and
· All liabilities are allocated to reportable segments, other than Group entity liabilities
The CODM monitors cash, receivables, and payables position. This is the information that the CODM receives and reviews to make decisions.
Geographical information
All the Group's operations and non-current assets are in
4 OTHER INCOME
Accounting Policy
|
Other income is recognised when the amount can be reliably measured and control of the right to receive the income be passed to the Group. Government grants relating to costs are deferred and recognised in the profit or loss over the period necessary to match them with the costs that they are intended to compensate. |
|
|
|
|
|
|
|
|
|
|
|
Settlement of tenement sale agreement (1) |
|
250,000 |
150,000 |
|
Sale of gold |
|
25,647 |
- |
|
Other sundry income |
|
52,031 |
82,740 |
|
|
|
327,679 |
232,740 |
|
|
|
|
|
(1) On 27 June 2024,
5 NET FINANCE INCOME
|
|
|
|
|
|
|
|
|
|
|
Interest income on deposits |
|
14,996 |
7,638 |
|
|
|
|
|
|
Interest expense on financial liabilities measured at amortised cost |
|
|
|
|
Interest on right of use lease liabilities |
20 |
(6,642) |
- |
|
Net finance income |
|
8,354 |
7,638 |
|
|
|
|
|
6 PERSONNEL EXPENSES AND EMPLOYEE BENEFITS
Accounting Policy
|
Short-term employee benefits Liabilities for wages and salaries, including non-monetary benefits, annual long service leave expected to be settled wholly within 12 months of the reporting date are measured at the amounts expected to be paid when the liabilities are settled.
Other long-term employee benefits The liability for annual and long service leave, not expected to settle within 12 months of the reporting date, are measured at the present value of expected future payments to be made in respect of services provided by employees up to the reporting date using the projected unit credit method. Consideration is given to expected future wage and salary levels, experience of employee departures and periods of service. Expected future payments are discounted using market yields at the reporting date on corporate bonds with terms to maturity and currency that match, as closely as possible, the estimated future cash outflows.
Defined contribution superannuation expense Contributions to defined contribution superannuation plans are expensed in the period in which they are incurred.
|
The table below sets out personnel costs expensed during the year.
|
|
|
|
|
|
|
|
|
|
|
Directors' remuneration (1) |
24 |
724,295 |
506,709 |
|
Staff salaries |
|
89,640 |
340,979 |
|
Superannuation |
|
7,668 |
37,508 |
|
Annual leave |
|
15,266 |
- |
|
Other associated personnel expenses |
|
5,113 |
- |
|
Reversal of legacy employee accruals (2) |
|
(35,964) |
- |
|
|
|
806,018 |
885,196 |
|
|
|
|
|
|
Expensed in capitalised exploration and evaluation |
|
- |
305,428 |
|
Expensed in personnel expenses |
|
806,018 |
579,768 |
|
|
|
806,018 |
885,196 |
|
|
|
|
|
(1) Director share-based payments expense of $166,915 is included in Directors' Remuneration.
(2) The reversal relates to legacy employee entitlement accruals in a dormant subsidiary following the closure of its office in prior years.
6 PERSONNEL EXPENSES AND EMPLOYEE BENEFITS (continued)
The table below sets out employee benefits at the reporting date.
|
|
|
|
|
|
|
|
|
|
|
Current |
|
|
|
|
Salary accrual |
|
- |
6,692 |
|
Superannuation |
|
- |
6,143 |
|
Liability for annual leave |
|
23,728 |
14,734 |
|
|
|
23,728 |
27,569 |
|
|
|
|
|
7 OTHER LOSSES
|
|
|
|
|
|
|
|
|
|
|
|
|
|
|
|
Loss on sale of property, plant, and equipment |
|
5,540 |
- |
|
Bad debt expense |
|
9,633 |
- |
|
Foreign exchange loss |
|
7,500 |
3,323 |
|
|
|
22,673 |
3,323 |
|
|
|
|
|
8 LOSS PER SHARE
Accounting Policy
|
Basic earnings per share Basic earnings per share is calculated by dividing the profit / (loss) attributable to the owners of
Diluted earnings per share Diluted earnings per share adjusts the figures used in the determination of basic earnings per share to accounts for the after-income tax effect of interest and other financing costs associated with dilutive potential ordinary shares and the weighted average number of shares assumed to have been issued for no consideration in relation to dilutive potential ordinary shares.
|
8 LOSS PER SHARE (continued)
|
|
|
|
|
|
|
|
|
|
|
Basic and diluted loss per share |
|
|
|
|
Loss after income tax attributable to owners of |
(6,329,313) |
(16,591,769) |
|
|
|
|
|
|
|
|
|
|
|
|
|
|
|
|
|
Basic loss per share |
|
(0.29) |
(1.00) |
|
Diluted loss per share |
|
(0.29) |
(1.00) |
|
|
|
|
|
|
|
|
|
|
|
Weighted average number of ordinary shares |
|
|
|
|
Issued ordinary shares on 1 July |
|
1,764,196,149 |
1,569,918,371 |
|
Effect of shares issued |
|
417,947,145 |
81,671,629 |
|
Weighted average number of ordinary shares on 30 June |
|
2,182,143,294 |
1,651,590,000 |
|
|
|
|
|
9 INCOME TAX EXPENSE
Accounting Policy
|
The income tax expense or benefit for the period is the tax payable on that period's taxable income based on the applicable income tax rate for each jurisdiction, adjusted by the changes in deferred tax assets and liabilities attributable to temporary differences, unused tax losses and the adjustment recognised for prior periods, where applicable.
Deferred tax assets and liabilities are recognised for temporary differences at the tax rates expected to be applied when the assets are recovered or liabilities are settled, based on those tax rates that are enacted or substantively enacted, except for:
· When the deferred income tax asset or liability arises from the initial recognition of goodwill or an asset or liability in as transaction that is not a business combination and that, at the time of the transaction, affects neither the accounting nor taxable profits, or · When the taxable temporary difference is associated with interests in subsidiaries, associates or joint ventures, and the timing of the reversal can be controlled, and it is probable that the temporary difference will not reverse in the foreseeable future.
Deferred tax assets are recognised for deductible temporary differences and unused tax losses only if it is probably that future taxable amounts will be available to utilise those temporary differences and losses.
The carrying amount of recognised and unrecognised deferred tax assets are reviewed at each reporting date. Deferred tax assets recognised are reduced to the extent that it is no longer probable that future taxable profits will be available for the carrying amount to be recovered. Previously unrecognised deferred tax assets are recognised to the extent that it is probable that there are future taxable profits available to recover the asset.
|
9 INCOME TAX EXPENSE (continued)
Accounting Policy (continued)
|
Deferred tax assets and liabilities are offset only where there is a legally enforceable right to offset current tax assets against current tax liabilities and deferred tax assets against deferred tax liabilities, and they relate to the same taxable authority on either the same taxable entity or different taxable entities which intend to settle simultaneously.
Goods and Services Tax ('GST') and other similar taxes Revenues, expenses, and assets are recognised net of the amount of, unless the GST incurred is not recoverable from the tax authority. In this case it is recognised as part of the cost of the acquisition of the asset or as part of the expense.
Receivables and payables are stated inclusive of the amount of GST receivable or payable. The net amount of GST recoverable from, or payable to, the tax authority is included in other receivables or other payables in the statement of financial position.
Cash flows are presented on a gross basis. The GST components of cash flows arising from investing or financing activities which are recoverable from or payable to the tax authority, are presented as operating cash flows.
Commitments and contingencies are disclosed net of the amount of GST recoverable from, or payable to, the taxation authority.
|
9 INCOME TAX EXPENSE (continued)
(a) Amounts recognised in profit or loss
|
|
|
|
|
|
|
|
|
|
|
|
|
|
|
|
Current tax expense |
|
- |
- |
|
Deferred tax expense |
|
- |
- |
|
Income tax expense |
|
- |
- |
|
|
|
|
|
|
Numerical reconciliation of income tax expense to prima facie tax payable |
|
|
|
|
Loss from continuing operations before income tax |
|
(6,329,313) |
(16,591,769) |
|
|
|
|
|
|
Tax at the Australian tax rate of 30% (2024: 30%) |
|
(1,898,794) |
(4,977,531) |
|
|
|
|
|
|
Non-deductible expenses |
|
194,426 |
831,438 |
|
Timing differences |
|
(86,488) |
3,655,158 |
|
Tax losses utilised not brought to account |
|
1,790,856 |
490,935 |
|
Income tax expense |
|
- |
- |
|
|
|
|
|
|
Tax losses |
|
|
|
|
Potential future income tax benefits attributed to tax losses, not brought to account |
|
14,949,548 |
12,766,220 |
|
|
|
|
|
|
|
|
|
|
All unused tax losses were incurred by Australian entities.
The benefit of these tax losses will only be obtained if:
i) future assessable income is derived of a nature and of an amount sufficient to enable the benefit to be realised
ii) the conditions for deductibility imposed by tax legalisation continue to be complied with
iii) no changes in tax legislation adversely affect the Group in realising the benefit, and
iv) satisfaction of either the continuity of ownership or the same business test.
9 INCOME TAX EXPENSE (continued)
(b) Unrecognised deferred tax assets and liabilities
Deferred tax liabilities have not been recognised in respect of the following items:
|
|
|
|
|
|
|
|
|
|
|
|
|
|
|
|
Deferred tax assets |
|
|
|
|
Tax losses carry forward |
|
14,949,548 |
12,766,220 |
|
Employee benefits obligation |
|
7,118 |
- |
|
Provisions |
|
1,037,932 |
1,776,977 |
|
|
|
15,994,598 |
14,543,197 |
|
|
|
|
|
|
Deferred tax liabilities |
|
|
|
|
Capitalised exploration costs |
|
8,632,856 |
10,264,063 |
|
|
|
|
|
|
Net unrecognised deferred tax assets |
|
7,361,742 |
4,279,134 |
|
|
|
|
|
10 CASH AND CASH EQUIVALENTS
Accounting Policy
|
Cash and cash equivalents include cash on hand, deposits held at call with financial institutions, other short-term, highly liquid investments with original maturities of three months or less that are readily convertible to known amounts of cash, and which are subject to an insignificant risk of changes in value. For the statement of cash flows presentation purposes, cash and cash equivalent also includes, bank overdrafts, which are shown within borrowings in current liabilities on the statement of financial position.
|
(a) Reconciliation of cash recorded in Statement of Financial Position to Statement of Cash Flows
|
|
|
|
|
|
|
|
|
|
|
|
|
|
|
|
Cash and cash equivalents in the statement of cash flows |
|
1,153,986 |
572,628 |
|
|
|
|
|
10 CASH AND CASH EQUIVALENTS (continued)
(b) Reconciliation of cash flows from operating activities
|
|
|
|
|
|
|
|
|
|
|
Cash flows from operating activities |
|
|
|
|
Loss for the period |
|
(6,329,313) |
(16,591,769) |
|
Adjustments for: |
|
|
|
|
Exploration expenditure impaired |
|
4,245,026 |
55,572 |
|
Impairment of development asset |
|
- |
12,128,289 |
|
Gain on disposal of exploration assets |
|
(351,037) |
- |
|
Net profit on foreign exchange translation |
|
(7) |
- |
|
Equity-settled share-based payments |
|
485,313 |
70,004 |
|
Depreciation and amortisation |
|
94,197 |
123,906 |
|
Bad debts expense |
|
9,633 |
- |
|
Loss on disposal of property, plant, and equipment |
|
5,540 |
- |
|
Loss on revaluation of financial assets |
|
761,531 |
2,666,250 |
|
Change in trade and other receivables |
|
(6,995) |
(53,584) |
|
Change in prepayments and deposits |
|
1,039 |
- |
|
Change in trade and other payables |
|
(617,137) |
(408,377) |
|
Change in employee benefits provision |
|
(3,841) |
- |
|
Change in site restoration provision |
|
- |
200,000 |
|
Net cash used in operating activities |
|
(1,706,051) |
(1,809,709) |
|
|
|
|
|
(c) Changes in liabilities arising from financing activities
|
|
|
|
|
|
|
|
|
|
|
Opening balance |
|
47,792 |
152,959 |
|
Net cash used in financing activities |
|
(111,150) |
(109,924) |
|
Right-of-use lease liabilities |
|
226,757 |
4,757 |
|
|
|
163,399 |
47,792 |
|
|
|
|
|
11 TRADE AND OTHER RECEIVABLES
|
|
|
|
|
|
|
|
|
|
|
Current |
|
|
|
|
Amounts due from joint venture partners |
|
104,447 |
31,150 |
|
Authorised government agencies |
|
12,475 |
14,915 |
|
Other receivables |
|
447 |
112 |
|
|
|
117,369 |
46,177 |
|
|
|
|
|
Other receivables are non-interest bearing. Note 23 includes disclosures relating to the credit risk exposures and analysis relating to the allowance for expected credit losses.
12 OTHER FINANCIAL ASSETS
Accounting Policy
|
Investments and other financial assets are initially measured at fair value. Transaction costs are included as part of the initial measurement, except for financial assets at fair value through profit or loss. Such assets are subsequently measured at either amortised cost or fair value depending on their classification. Classification is determined based on both the business model within which such assets are held and the contractual cash flow characteristics of the financial asset unless an accounting mismatch is being avoided.
Financial assets are derecognised when the rights to receive cash flows have expired or have been transferred and the Group has transferred substantially all the risks and rewards of ownership. When there is no reasonable expectation of recovering part, or all, of a financial asset, the carrying value is written off.
Financial assets at fair value through profit or loss Financial assets not measured at amortised cost or at fair value through other comprehensive income are classified as financial assets at fair value through profit or loss. Typically, such financial assets will be either: (i) held for trading, where they are acquired for the purpose of selling in the short-term with an intention of making a profit, or a derivative; or (ii) designated as such upon initial recognition where permitted. Fair value movements are recognised in profit or loss.
Financial assets at fair value through other comprehensive income Financial assets at fair value through other comprehensive income include equity investments which the Group intends to hold for the foreseeable future and has irrevocably elected to classify them as such upon initial recognition. Impairment of financial assets The Group recognises a loss allowance for expected credit losses on financial assets which are either measured at amortised cost or fair value through other comprehensive income. The measurement of the loss allowance depends upon the Group's assessment at the end of each reporting period as to whether the financial instrument's credit risk has increase significantly since initial recognition, based on reasonable and supportable information that is available, without undue cost or effort to obtain.
|
|
|
12 OTHER FINANCIAL ASSETS (continued)
Accounting Policy (continued)
|
Where there has not been a significant increase in exposure to credit risk since initial recognition, as 12-month expected credit loss allowance is estimated. This represents a portion of the asset's lifetime expected credit losses that is attributable to a default event that is possible within the next 12 months. Where a financial asset has become credit impaired, or where it is determined that credit risk has increased significantly, the loss allowance is based on the asset's lifetime expected credit losses. The amount of expected credit loss recognised is measure on the probably weighted present value of anticipated cash shortfalls over the life of the instrument discounted at the original effective interest rate.
For financial assets mandatorily measured at fair value through other comprehensive income, the loss allowance is recognised in other comprehensive income with a corresponding expense through profit or loss. In all other cases, the loss allowance reduces the asset's carrying value with a corresponding expense through profit or loss. Impairment of financial assets The Group recognises a loss allowance for expected credit losses on financial assets which are either measured at amortised cost or fair value through other comprehensive income. The measurement of the loss allowance depends upon the Group's assessment at the end of each reporting period as to whether the financial instrument's credit risk has increase significantly since initial recognition, based on reasonable and supportable information that is available, without undue cost or effort to obtain.
Where there has not been a significant increase in exposure to credit risk since initial recognition, as 12-month expected credit loss allowance is estimated. This represents a portion of the asset's lifetime expected credit losses that is attributable to a default event that is possible within the next 12 months. Where a financial asset has become credit impaired, or where it is determined that credit risk has increased significantly, the loss allowance is based on the asset's lifetime expected credit losses. The amount of expected credit loss recognised is measure on the probably weighted present value of anticipated cash shortfalls over the life of the instrument discounted at the original effective interest rate.
For financial assets mandatorily measured at fair value through other comprehensive income, the loss allowance is recognised in other comprehensive income with a corresponding expense through profit or loss. In all other cases, the loss allowance reduces the asset's carrying value with a corresponding expense through profit or loss.
|
|
|
|
|
|
|
|
|
|
|
|
Current |
|
468,469 |
1,080,000 |
|
Non-current |
|
42,290 |
42,290 |
|
|
|
510,759 |
1,122,290 |
|
|
|
|
|
|
Listed ordinary shares - designated at fair value through profit or loss |
|
448,500 |
1,080,000 |
|
Unlisted options - designated at fair value through profit or loss |
|
19,969 |
- |
|
Deposits and bonds |
|
42,290 |
42,290 |
|
|
|
510,759 |
1,122,290 |
|
|
|
|
|
12 OTHER FINANCIAL ASSETS (continued)
Reconciliation
Reconciliation of the fair values at the beginning and end of the current and previous financial year are set out below:
|
|
|
|
|
|
|
|
|
|
|
|
|
Balance on 1 July 2023 |
3,746,250 |
- |
42,290 |
3,788,540 |
|
Fair value revaluation of 6,750,000 GRE shares at $0.16 per share |
(2,666,250) |
- |
- |
(2,666,250) |
|
Balance on 30 June 2024 |
1,080,000 |
- |
42,290 |
1,122,290 |
|
Issue of 688,705 GRE shares at $0.08 per share (1) |
55,096 |
- |
- |
55,096 |
|
Gain on initial recognition of 688,705 GRE at $0.085 per share |
3,444 |
- |
- |
3,444 |
|
Issue of 1,186,295 GRE shares at $0.08 per share (1) |
94,904 |
- |
- |
94,904 |
|
Issue of 937,500 free-attaching GRE options at fair value of $0.04 per share (2) |
- |
37,500 |
- |
37,500 |
|
Loss on initial recognition of 1,186,295 GRE shares at $0.074 per share (2) |
(7,118) |
- |
- |
(7,118) |
|
Fair value revaluation of 8,625,000 GRE shares |
(777,826) |
- |
- |
(777,826) |
|
Fair value revaluation of 937,500 GRE options |
- |
(17,531) |
- |
(17,531) |
|
Balance on 30 June 2025 |
448,500 |
19,969 |
42,290 |
510,759 |
|
|
|
|
|
|
(1) The issue of 688,705 fully paid ordinary GRE shares were calculated based on the capital raising announced in November 2024 (8 cents per share). On the date of issue, the share price was 8.5 cents per share resulting in a fair value gain of $3,444 on Day 1.
(2) The issue of 1,186,295 fully paid ordinary GRE shares were calculated based on the capital raising announced in November 2024 (8 cents per share). On the date of issue, the share price was 7.4 cents per share resulting in a fair value loss of $7,118 on Day 1.
|
|
|
|
|
|
|
|
|
|
|
Fair value movement on revaluation of fully paid listed shares |
|
781,500 |
2,666,250 |
|
Fair value movement on revaluation of unlisted options |
|
(19,969) |
- |
|
Net fair value loss on revaluation of financial assets |
|
761,531 |
2,666,250 |
|
|
|
|
|
Refer to note 23 for further information on financial instruments.
13 CAPITALISED EXPLORATION AND EVALUATION
Accounting Policy
|
Exploration and evaluation expenditure incurred is capitalised as an exploration and evaluation asset in respect of each separate area of interest for which the rights of tenure are current, and where: · Such expenditure is expected to be recouped through successful development and exploitation of the area of interest, or alternatively, by its sale; or · Exploration activities in the area of interest have not yet reached a stage that permits a reasonable assessment of the existence or otherwise of economically recoverable reserves, and active and significant operations in, or relating to, the area are continuing.
Capitalised costs include costs directly related to exploration and evaluation activities, such as acquisition of rights to explore, topographical, geological, geochemical and geophysical studies, exploratory drilling, trenching, sampling, and associated activities. General and administrative costs are expensed as incurred.
When an area of interest is abandoned, or the directors decide that it is not commercially viable, any accumulated costs in respect of that area are written off in the period the decision is made.
Exploration and evaluation assets are assessed for impairment when facts and circumstances suggest that the carrying amount may exceed its recoverable amount. Any impairment loss is recognised as an expense in the statement of profit or loss.
Once the technical feasibility and commercial viability of extracting a mineral resource are demonstrable, the capitalised expenditure for the area of interest is reclassified to development assets and is tested for impairment before reclassification.
|
13 CAPITALISED EXPLORATION AND EVALUATION (continued)
|
|
|
|
|
|
|
|
|
|
|
|
|
Balance on 1 July 2023 |
|
3,138,859 |
28,915,845 |
32,054,704 |
|
Additions |
|
- |
2,214,416 |
2,214,416 |
|
Impairment or write-offs |
|
- |
(55,572) |
(55,572) |
|
Balance on 30 June 2024 |
|
3,138,859 |
31,074,689 |
34,213,548 |
|
Additions |
|
- |
3,445,488 |
3,445,488 |
|
Transfer to investment in joint venture (1) |
16 |
- |
(1,498,963) |
(1,498,963) |
|
Exploration expenditure written off current year (2) |
|
- |
(4,245,026) |
(4,245,026) |
|
Balance on 30 June 2025 |
|
3,138,859 |
28,776,188 |
31,915,047 |
|
|
|
|
|
|
(1) During the year,
(2) Exploration expenditure written off during the year relates to the Paterson project where
14 DEVELOPMENT EXPENDITURE
Accounting Policy
|
Development Assets Development assets comprise costs directly attributable to the development of mining areas and are capitalised on an area-by-area basis one technical feasibility and commercial viability have been established. Capitalised development costs include acquisition costs, construction, installation, and other expenditure necessary to prepare the assets for their intended use, together with the initial estimate of rehabilitation obligations.
Items of property, plant and equipment used in development activities are carried at cost less accumulated depreciation and impairment losses. Capitalised development expenditure is not depreciated until the asset is available for use, at which point it is depreciated over the useful life of the related mine or area of interest on a units-of-production basis.
Impairment Development assets are tested for impairment in accordance with AASB 136 Impairment of Assets whenever indicators of impairment exist. The recoverable amount is determined as the higher of fair value less costs of disposal and value in use, which requires judgement in estimating future cash flows, commodity prices, operating and capital costs, discount rates and inflation assumptions.
|
14 DEVELOPMENT EXPENDITURE (continued)
Accounting Policy
|
During the year, the Group engaged an independent expert to review the site rehabilitation provision. The reassessment resulted in a reduction of the estimated rehabilitation obligation, which has been reflected as a corresponding reduction in the carrying amount of development expenditure.
An independent assessment of the Group's development asset was also undertaken during the year. Based on this assessment, the recoverable amount exceeded the adjusted carrying amount, and accordingly no impairment was recognised. |
|
|
|
|
|
|
|
|
|
|
|
|
|
|
|
|
Opening balance |
|
3,042,873 |
14,950,070 |
|
Additions |
|
- |
21,092 |
|
Impairment |
|
- |
(12,128,289) |
|
Transfer to property, plant, and equipment |
15 |
(69,437) |
- |
|
Change in site restoration estimates |
19 |
(2,463,486) |
200,000 |
|
Closing balance |
|
509,950 |
3,042,873 |
|
|
|
|
|
15 PROPERTY, PLANT AND EQUIPMENT
Accounting Policy
|
Plant and equipment are stated at historical cost less accumulated depreciation and impairment. Historical cost includes expenditure that is directly attributable to the acquisition of the items.
Depreciation is calculated on systematic basis to write off the net cost of each item of property, plant, and equipment (excluding land) over its expected useful life. The residual values, useful lives and deprecation methods are reviewed, and adjusted if appropriate, at each reporting date.
Leasehold improvements are depreciated over the unexpired period of the lease or the estimated useful life of the assets, whichever is shorter.
An item of property, plant and equipment is derecognised upon disposal or when no future economic benefits are expected from its use. Gains and losses between the carrying amount and the disposal proceeds are recognised in profit or loss. Any revaluation surplus reserve relating to the item disposed of is transferred directly to retained earnings / accumulated losses.
|
15 PROPERTY, PLANT AND EQUIPMENT (continued)
|
|
|
|
|
|
|
|
|
|
|
Field equipment - at cost |
|
107,424 |
- |
|
Less: accumulated depreciation |
|
(56,524) |
- |
|
|
|
50,900 |
- |
|
|
|
|
|
|
Computer and office equipment - at cost |
|
106,970 |
165,685 |
|
Less: accumulated depreciation |
|
(100,715) |
(151,044) |
|
|
|
6,255 |
14,641 |
|
|
|
|
|
|
Mobile equipment and motor vehicles - at cost |
|
51,683 |
55,955 |
|
Less: accumulated depreciation |
|
(41,297) |
(36,261) |
|
|
|
10,386 |
19,694 |
|
|
|
67,541 |
34,335 |
|
|
|
|
|
Reconciliations
Reconciliations of the written down values at the beginning and end of the current and previous financial year are set out below:
|
|
|
|
|
|
|
|
|
|
|
|
|
|
|
|
|
|
|
Balance on 1 July 2023 |
- |
30,031 |
27,235 |
22,541 |
|
Additions |
- |
- |
- |
117,250 |
|
Disposals |
- |
- |
(4,807) |
(105) |
|
Depreciation expense |
- |
(10,337) |
(7,787) |
(27,061) |
|
Balance on 30 June 2024 |
- |
19,694 |
14,641 |
34,335 |
|
Transfer from capitalised development |
69,437 |
- |
- |
69,437 |
|
Additions |
- |
- |
680 |
680 |
|
Disposals |
(15,578) |
(4,272) |
(59,394) |
(79,244) |
|
Depreciation write-back on disposals |
8,877 |
5,301 |
56,211 |
70,389 |
|
Depreciation expense |
(11,836) |
(10,337) |
(5,883) |
(28,056) |
|
Balance on 30 June 2025 |
50,900 |
10,386 |
6,255 |
67,541 |
|
|
|
|
|
|
16 INCORPORATED JOINT VENTURE
Accounting Policy
|
Interests in incorporated joint ventures are accounted for using the equity method in accordance with AASB 128 Investments in Associates and Joint Ventures. Under the equity method, the investment is initially recognised at cost and adjusted thereafter for the Company's share of the joint venture's profit or loss and other comprehensive income.
The cost of the investment includes the fair value of assets transferred to the joint venture. Any difference between the carrying amount of the assets transferred and their fair value at the date of contribution is recognised in profit or loss.
The Company's share of the joint venture's results is recognised from the date on which joint control commences until the date that it ceases. Distributions received from the joint venture reduce the carrying amount of the investment. |
On 1 April 2025, the Company and GreenTech Metals Limited (GRE) executed a binding agreement to consolidate the lithium mineral rights from their respective tenement holdings into a newly incorporated joint venture company, Andover Lithium Pty Ltd ("Andover"), each holding 50% of the issued shares. The Osborne Joint Venture currently in place between the parties (51% Artemis, 49% Artemis) retains all mineral rights other than gold and lithium. Artemis retains all other mineral rights over the tenements for which the Company is the registered holder, and any other mineral recovered.
The Company contributed lithium exploration assets to Andover with a carrying value of $1,498,963. An independent valuation determined the fair value of the joint venture at $3,700,000, with each party's interest valued at $1,850,000.
Accordingly, the Company recognised:
· An investment in Andover of $1,850,000, and
· A gain on contribution of $351,037 in the statement of profit or loss for the year ended 30 June 2025.
The investment is accounted for using the equity method.
As Andover had not commenced operations or incurred any expenditure by 30 June 2025, no share of results has been recognised during the reporting period.
The carrying value will be reviewed at each reporting period. Future contributions or recognition of the Company's share of Andover's results will be reflected once operational activity commences.
16 INCORPORATED JOINT VENTURE (continued)
Summarised Financial Information of Andover Lithium Pty Ltd
|
|
|
|
|
|
|
|
|
|
|
Total Assets |
|
3,700,000 |
- |
|
Total Liabilities |
|
- |
- |
|
Net Assets |
|
3,700,000 |
- |
|
|
|
|
|
|
Issued Capital |
|
3,700,000 |
- |
|
Retained Earnings |
|
- |
- |
|
Total equity |
|
3,700,000 |
- |
|
|
|
|
|
|
Profit / (loss) for the year |
|
- |
- |
|
Total comprehensive income / (loss) for the year |
|
- |
- |
|
|
|
|
|
17 RIGHT-OF-USE ASSETS
Accounting Policy
|
A right-of-use asset is recognised at the commencement date of a lease. The right-of-use asset is measured at cost, which comprises the initial amount of the lease liability, adjusted for, as applicable, any lease payments made at or before the commencement date net of any lease incentives received, any initial direct costs incurred, and, except when included in the cost of inventories, an estimate of costs expected to be incurred for dismantling and removing the underlying asset, and restoring the site or asset.
Right-of-use assets are depreciated on a straight-line basis over the unexpired period of the lease or the estimated useful life of the asset, whichever is the shorter. Where the Group expects to obtain ownership of the leased asset at the end of the lease term, the depreciation is over its estimated useful life. Right-of-use assets are subject to impairment or adjusted for any remeasurement of lease liabilities.
The Group has elected not to recognise a right-of-use asset and corresponding lease liability for short-term leases with terms of 12 months or less and leases of low-value assets. Lease payments on these assets are expensed to profit or loss as incurred. |
|
|
|
|
|
|
|
|
|
|
|
Land and buildings - right of use |
|
226,757 |
150,781 |
|
Less: accumulated depreciation |
|
(66,141) |
(105,782) |
|
|
|
160,616 |
44,999 |
|
|
|
|
|
Additions to the right-of-use assets during the year were $226,757.
The Group leases land and buildings as a storage facility for its field equipment and has various exploration tenement leases under agreements of between five and fifteen years with, in some cases, options to extend. The leases have various escalation clauses. On renewal, the terms of the leases are renegotiated.
18 TRADE AND OTHER PAYABLES
|
|
|
|
|
|
|
|
|
|
|
Current |
|
|
|
|
Trade payables |
|
647,621 |
238,112 |
|
Other payables and accrued expenses |
|
564,814 |
868,069 |
|
Cash received in advance of share issue |
|
- |
256,394 |
|
|
|
1,212,435 |
1,362,575 |
|
|
|
|
|
Refer to note 23 for further information on financial instruments.
19 SITE REHABILITATION PROVISION
Accounting Policy
|
Provisions for the costs of rehabilitation, decommissioning and restoration of the area disturbed during mineral exploration and development activities depends on the legal requirements at the date of decommissioning, the costs and timing of work and the discount rate applied.
The initial estimate of rehabilitation and restoration costs is capitalised as part of the cost of the related development asset and amortised over the life of the related mine or plant. The provision is measured at the present cost of future expenditures, with the unwinding of the discount recognised as a finance costs.
Subsequent changes in estimated restoration costs or in discount rates are adjusted against the carrying value of the development asset, unless that asset has been written down below its recoverable amount, in which case, any excess is recognised immediately in profit or loss.
|
|
|
|
|
|
|
|
|
|
|
|
Opening balance |
|
5,923,259 |
5,723,259 |
|
Adjustment to provision recognised against development asset |
14 |
(2,463,486) |
200,000 |
|
|
|
3,459,773 |
5,923,259 |
|
|
|
|
|
During the year, management engaged an independent expert to reassess the Group's site rehabilitation obligation. Based on this review, the estimated provision was revised downward by $2,463,486. The revision reflects updated cost estimates, timing of expected closure, and revised discount and inflation assumptions.
Key assumptions applied in determining the provision are as follows:
· Expected rehabilitation years: 2025 to 2035
· Discount rate: 4.21%
· Inflation rate: 2.1%
· Source of estimates: independent expert engaged in June 2025
20 LEASE LIABILITIES
Accounting Policy
|
A lease liability is recognised at the commencement date of a lease. The lease liability is initially recognised at the present value of the lease payments to be made over the term of the lease, discounted using the interest rate implicit in the lease or, if that rate cannot be readily determined, the Group's incremental borrowing rate. Lease payments comprise of fixed payments less any lease incentives receivable, variable lease payments that depend on an index or a rate, amounts expected to be paid under residual value guarantees, exercise price of a purchase option when the exercise of the option is reasonably certain to occur, and any anticipated termination penalties. The variable lease payments that to not depend on an index or a rate are expensed in the period in which they are incurred.
Lease liabilities are measured at amortised cost using the effective interest method. The carrying amounts are remeasured if there is a change in the following:
· future lease payments arising from a change in an index, or a rate used · residual guarantee · lease term, or · certainty of a purchase option and termination penalties.
When a lease liability is remeasured, an adjustment is made to the corresponding right-of-use asset, or to profit or loss if the carrying amount of the right-of-use asset is fully written down.
|
20 LEASE LIABILITIES
|
|
|
|
|
|
|
|
|
|
|
|
|
|
|
|
Opening balance |
|
47,792 |
152,959 |
|
Recognition of lease liabilities |
|
226,757 |
- |
|
Interest charged |
|
6,642 |
4,757 |
|
Interest repaid |
|
(6,642) |
(4,757) |
|
Less principal repayments |
|
(111,150) |
(105,167) |
|
Lease liabilities included in the consolidated statement of financial position |
|
163,399 |
47,792 |
|
|
|
|
|
|
Current |
|
113,894 |
47,792 |
|
Non-current |
|
49,505 |
- |
|
|
|
163,399 |
47,792 |
|
|
|
|
|
Refer to note 23 for further information on financial instruments.
21 SHARE CAPITAL
Accounting Policy
|
Ordinary shares are classified as equity.
Incremental costs directly attributable to the issue of new shares or options are shown in equity as a deduction, net of tax, from the proceeds.
|
Issued capital
|
|
|
|||
|
|
|
|
||
|
|
|
|
|
|
|
|
|
|
|
|
|
Balance on 1 July |
1,764,196,149 |
1,569,918,371 |
120,237,759 |
117,396,554 |
|
Issue of fully paid shares for cash |
727,114,848 |
194,277,778 |
5,942,862 |
3,173,250 |
|
Issue of shares in satisfaction of service provider fees (1) |
42,861,168 |
- |
300,028 |
- |
|
Issue of shares as bonus director fees (2) |
1,500,000 |
- |
25,000 |
- |
|
Capital raising costs |
- |
- |
(843,823) |
(332,045) |
|
Balance on 30 June |
2,535,672,165 |
1,764,196,149 |
125,661,826 |
120,237,759 |
|
|
|
|
|
|
(1) 42,861,168 ordinary shares were issued to suppliers in settlement of trade payables totalling $300,028. The issue price of $0.007 per share was consistent with the Company's capital raisings in December 2024 and February 2025.
(2) 1,500,000 ordinary shares were issued to a director as part of a contractual bonus arrangement. These shares had a deemed fair value of $25,000, recognised as an expense in accordance with AASB 2 Share-based payments. Further details are set out in note 22.
Ordinary shares entitle the holder to participate in dividends and the proceeds on the winding up of the company in proportion to the number of and amounts paid on the shares held. The fully paid ordinary shares have no par value, and the company does not have a limited amount of authorised capital.
On a show of hands every member present at a meeting in person or by proxy shall have one vote and upon a poll each share shall have one vote.
There is no current on-market share buy-back.
Reserves
Share-based payments reserve
The share-based payments reserve represents the fair value of shares to be issued to directors, consultants, and employees. This reserve will be transferred to capital once the shares are issued. Refer to note 22.
22 SHARE-BASED PAYMENTS
Accounting Policy
|
Equity-settled and cash-settled share-based compensation benefits are provided to employees.
Equity-settled transactions also include the issue of shares to employees, directors or consultants in exchange for services. Where shares are issued, the fair value is measured at the grant date, based on the Company's share price (or the volume weighted average price over a specified period, where applicable). The fair value of shares issued is recognised as an expense in the period in which the related services are rendered, with a corresponding increase in equity.
Equity-settled transactions are awards of shares, or options over shares, that are provided to employees in exchange for the rendering of services. Cash-settled transactions are awards of cash for the exchange of services, where the amount of cash is determined by reference to the share price.
The cost of equity-settled transactions is measured at fair value on grant date. Fair value is independently determined using the Black-Scholes option pricing model that considers the exercise price, the term of the option, the impact of dilution, the share price at grant date and expected price volatility of the underlying share, the expected dividend yield and the risk-free interest rate for the term of the option, together with non-vesting conditions that do not determine whether the Group receives the services that entitle the employees to receive payment. No account is taken of any other vesting conditions.
The cost of equity-settled transactions is recognised as an expense with a corresponding increase inequity over the vesting period. The cumulative charge to profit or loss is calculated based on the grant date fair value of the award, the best estimate of the number of awards that are likely to vet and the expired portion of the vesting period. The amount recognised in profit or loss for the period is the cumulative amount calculated at each reporting date less amounts already recognised in previous periods.
The cost of cash-settled transactions is initially, and at each reporting date until vested, determined by applying the Black-Scholes option pricing model, taking into consideration the terms and conditions on which the award was granted. The cumulative charge to profit or loss until settlement of the liability is calculated as follows:
· during the vesting period, the liability at each reporting date is the fair value of the award at that date multiplied by the expired portion of the vesting period · from the end of the vesting period until settlement of the award, the liability is the full fair value of the liability at the reporting date.
All changes in the liability are recognised in profit or loss. The ultimate cost of cash-settled transactions is the cash paid to settle the liability.
Market conditions are taken into consideration in determining fair value. Therefore, any awards subject to market conditions are considered to vest irrespective of whether that market condition has been met or not, provided all other conditions are satisfied.
If equity-settled awards are modified, as a minimum an expense is recognised as if the modification has not been made. An additional expense is recognised, over the remaining vesting period, for any modification that increases the total fair value of the share-based compensation benefit as at the date of modification.
|
22 SHARE-BASED PAYMENTS (continued)
Accounting Policy
|
If the non-vesting condition is within the control of the Group or employee, the failure to satisfy the condition is treated as a cancellation. If the condition is not within the control of the Group or employee, and is not satisfied during the vesting period, any remaining expense for the award is recognised over the remaining vesting period, unless the award is forfeited.
If equity-settled awards are cancelled, it is treated as if it has vested on the date of cancellation, and any remaining expense is recognised immediately. If a new replacement award is substituted for the cancelled award, the cancelled and new award is treated as if they were a modification. |
The share-based payment expense included within the consolidated financial statements can be broken down as follows:
|
|
|
|
|
|
|
|
|
|
|
Expensed in Personnel Expenses and Other Employee Benefits |
|
|
|
|
Options issued to directors |
|
141,915 |
- |
|
Shares issued to directors (1) |
|
25,000 |
- |
|
|
|
|
|
|
Expensed in Professional Fees |
|
|
|
|
Shares to be issued to consultants (2) |
|
18,370 |
70,004 |
|
|
|
|
|
|
Expensed in Statement of Financial Position |
|
|
|
|
Capital raising costs |
|
384,341 |
146,947 |
|
|
|
569,626 |
216,951 |
|
|
|
|
|
(1) 1,500,000 ordinary shares were issued to a director under a contractual bonus arrangement. The fair value of the shares at grant date was determined with reference to the VWAP of the Company's shares, being $0.167 per share
(2) On 17 February 2025, the Company entered an arrangement with a consultant under which ordinary share with a total fair value of $25,000 will be issued at the end of a six-month vesting period ending on 17 August 2025. An expense of $18,370 has been recognised on 30 June 2025, representing the pro-rata portion of the vesting period completed. The remaining $6,630 will be recognised in the 2026 financial year.
22 SHARE-BASED PAYMENT PLANS (continued)
Share-based payment programme
The Company has adopted an Employee Share Option Scheme ("ESOS"). Under the ESOS, the Company may grant options and rights to Company eligible employees to acquire securities to a maximum of 10% of the Company's total issued ordinary shares at the date of the grant. The fair value of share options granted is measured using the Black Scholes option pricing model.
The options and rights vest on a time scale as specified in the ESOS and are granted for no consideration. Options and rights granted under the plan carry no dividend or voting rights. When exercisable, each option is converted into one ordinary share. The maximum term of an option is 5 years from grant date, and the exercise price is settled in cash.
Options will not be transferable and will not be listed on the ASX unless the offer provides otherwise or the Board in its absolute discretion approves.
Options
On 30 June 2025, a summary of the Group options issued and not exercised under the share-based payment programme are as follows. Options are settled by the physical delivery of shares:
|
|
|
|
|
|
|
|
|
|
|
|
||||
|
01-Jul-22 |
01-Jul-22 |
31-Jul-25 |
5.0 |
2,000,000 |
- |
- |
- |
2,000,000 |
2,000,000 |
|
||||
|
05-Sep-22 |
05-Sep-22 |
31-Jul-25 |
5.0 |
3,000,000 |
- |
- |
- |
3,000,000 |
3,000,000 |
|
||||
|
08-Mar-23 |
08-Mar-23 |
09-Mar-26 |
2.5 |
17,000,000 |
- |
- |
- |
17,000,000 |
17,000,000 |
|
||||
|
28-Oct-23 |
28-Oct-23 |
09-Mar-26 |
2.5 |
11,000,000 |
- |
- |
- |
11,000,000 |
11,000,000 |
|
||||
|
29-Oct-23 |
29-Oct-23 |
09-Mar-26 |
2.5 |
5,000,000 |
- |
- |
- |
5,000,000 |
5,000,000 |
|
||||
|
28-Apr-24 |
28-Apr-24 |
31-Jul-25 |
5.0 |
2,000,000 |
- |
- |
- |
2,000,000 |
2,000,000 |
|
||||
|
30-Sep-24 |
30-Sep-24 |
09-Mar-26 |
2.5 |
- |
35,000,000 |
- |
- |
35,000,000 |
35,000,000 |
|
||||
|
25-Nov-24 |
20-Dec-24 |
20-Dec-27 |
2.0 |
- |
15,000,000 |
- |
- |
15,000,000 |
15,000,000 |
|
||||
|
10-Feb-25 |
25-Feb-25 |
20-Dec-27 |
2.0 |
- |
10,000,000 |
- |
- |
10,000,000 |
10,000,000 |
|
||||
|
10-Feb-25 |
06-Mar-25 |
04-Mar-27 |
1.5 |
- |
67,321,429 |
- |
- |
67,321,429 |
67,321,429 |
|
||||
|
Total |
40,000,000 |
127,321,429 |
- |
- |
167,321,429 |
167,321,429 |
- |
|||||||
|
Weighted average exercise price (cents) |
2.94 |
1.87 |
- |
- |
2.13 |
2.13 |
- |
|||||||
|
|
|
|
|
|
|
|
|
|||||||
At the reporting date, the weighted average remaining contractual life of options outstanding at year end was 1.33 years.
22 SHARE-BASED PAYMENT PLANS (continued)
Key valuation assumptions made at valuation date under the Black & Scholes option pricing model are summarised below:
|
|
|
|
|
|
|
|
|
|
|
|
|
2,000,000 |
5.0 |
01-Jul-22 |
31-Jul-25 |
3.08 |
100 |
3.13 |
1.40 |
2.7 |
|
|
3,000,000 |
5.0 |
05-Sep-22 |
31-Jul-25 |
2.90 |
100 |
2.99 |
1.51 |
3.0 |
|
|
17,000,000 |
2.5 |
08-Mar-23 |
09-Mar-26 |
3.01 |
100 |
3.48 |
0.73 |
1.4 |
|
Tranche 4 |
11,000,000 |
2.5 |
28-Oct-23 |
09-Mar-26 |
2.36 |
100 |
4.32 |
1.40 |
2.3 |
|
|
5,000,000 |
2.5 |
29-Oct-23 |
09-Mar-26 |
2.36 |
100 |
4.32 |
1.29 |
2.3 |
|
Tranche 6 |
2,000,000 |
5.0 |
28-Apr-24 |
31-Jul-25 |
1.26 |
100 |
4.00 |
0.28 |
1.7 |
|
Tranche 7 |
35,000,000 |
2.5 |
30-Sep-24 |
09-Mar-26 |
1.44 |
100 |
3.50 |
0.38 |
1.3 |
|
Tranche 8 |
15,000,000 |
2.0 |
25-Nov-24 |
20-Dec-27 |
3.07 |
100 |
3.62 |
0.71 |
1.3 |
|
Tranche 9 |
10,000,000 |
2.0 |
10-Feb-25 |
20-Dec-27 |
2.86 |
100 |
3.91 |
0.348 |
0.8 |
|
Tranche 10 |
67,321,429 |
1.5 |
10-Feb-25 |
04-Mar-27 |
2.06 |
100 |
3.89 |
0.382 |
0.9 |
|
|
|
|
|
|
|
|
|
|
|
22 SHARE-BASED PAYMENT PLANS (continued)
Options (continued)
On 30 June 2024, a summary of the Group options issued and not exercised under the share-based payment programme are as follows. Options are settled by the physical delivery of shares:
|
|
|
|
|
|
|
|
|
|
|
||||
|
20-Dec-21 |
20-Dec-21 |
20-Dec-23 |
15 |
2,000,000 |
- |
- |
(2,000,000) |
- |
- |
||||
|
01-Jul-22 |
01-Jul-22 |
31-Jul-25 |
5.0 |
2,000,000 |
- |
- |
- |
2,000,000 |
2,000,000 |
||||
|
05-Sep-22 |
05-Sep-22 |
31-Jul-25 |
5.0 |
3,000,000 |
- |
- |
- |
3,000,000 |
3,000,000 |
||||
|
08-Mar-23 |
08-Mar-23 |
09-Mar-26 |
2.5 |
17,000,000 |
- |
- |
- |
17,000,000 |
17,000,000 |
||||
|
28-Oct-23 |
28-Oct-23 |
09-Mar-26 |
2.5 |
- |
11,000,000 |
- |
- |
11,000,000 |
11,000,000 |
||||
|
29-Oct-23 |
29-Oct-23 |
09-Mar-26 |
2.5 |
- |
5,000,000 |
- |
- |
5,000,000 |
5,000,000 |
||||
|
28-Apr-24 |
28-Apr-24 |
31-Jul-25 |
5.0 |
- |
2,000,000 |
- |
- |
2,000,000 |
2,000,000 |
||||
|
01-Jul-22 |
01-Jul-22 |
31-Jul-25 |
5.0 |
- |
2,000,000 |
- |
- |
2,000,000 |
2,000,000 |
||||
|
Total |
24,000,000 |
18,000,000 |
- |
(2,000,000) |
40,000,000 |
40,000,000 |
|||||||
|
Weighted average exercise price (cents) |
4.06 |
2.78 |
- |
15.0 |
2.94 |
2.94 |
|||||||
|
|
|
|
|
|
|
|
|||||||
At the exercise date, the weighted average remaining contractual life of options outstanding at year end was 1.58 years.
23 FINANCIAL INSTRUMENTS
Accounting Policy
|
Recognition and derecognition Financial assets and liabilities are recognised when the Group becomes a party to the contractual provisions of the financial instrument.
Financial assets are derecognised when the contractual rights to the cash flows from the financial asset expire, or when the financial asset and substantially all the risks and rewards are transferred.
A financial liability is derecognised when it is extinguished, discharged, cancelled, or expires.
Classification and initial measurement of financial assets Except for those trade receivables that do not contain a significant financing component and are measured at the transaction price in accordance with AASB 15, all financial assets are initially measured at fair value adjusted for transaction costs (where applicable).
For subsequent measurement, financial assets, other than those designated and effective as hedging instruments, are classified into the following categories:
· amortised cost · fair value through profit or loss (FVTPL) · equity instruments at fair value through other comprehensive income (FVOCI) · debt instruments at fair value through other comprehensive income (FVOCI).
All income and expenses relating to financial assets that are recognised in profit or loss are presented within finance costs, finance income or other financial items, except for impairment of trade receivables which is presented within other expenses.
The classification is determined by both:
· the entity's business model for managing the financial asset; and · the contractual cash flow characteristics of the financial asset.
Subsequent remeasurement of financial assets Financial assets at amortised cost Financial assets are measured at amortised cost if the assets meet the following conditions (and are not designated as FVTPL):
· they are held within a business model whose objective is to hold the financial assets to collect its contractual cash flows · the contractual terms of the financial assets give rise to cash flows that are solely payments of principal and interest on the principal amount outstanding.
|
23 FINANCIAL INSTRUMENTS (continued)
Accounting Policy (continued)
|
After initial recognition, these are measured at amortised costs using the effective interest method.
Discounting is omitted where the effect of discounting is immaterial. The Group's cash and cash equivalents, trade and most other receivables fall into this category of financial instruments as well as listed bonds that were previously classified as held-to-maturity under AASB 139.
Impairment of financial assets AASB 9's impairment requirements use more forward-looking information to recognise expected credit losses - the 'expected credit loss (ECL) model'.
Instruments within the scope of the requirements included loans and other debt-type financial assets measured at amortised cost and FVOCI, trade receivables, contract assets recognised and measured under AASB 15 and loan commitments that are not measured at fair value through profit or loss.
The Group considers a broad range of information when assessing credit risk and measuring expected credit losses, including past events, current conditions, reasonable and supportable forecasts that affect the expected collectability of the future cash flows of the instrument.
In applying this forward-looking approach, a distinction is made between:
· financial instruments that have not deteriorated significantly in credit quality since initial recognition or that have low credit risk ('Level 1'); and · financial instruments that have deteriorated significantly in credit quality since initial recognition and whose credit risk is not low ('Level 2'). · 'Level 3' would cover financial assets that have objective evidence of impairment at the reporting date.
'12-month expected credit losses' are recognised for the first category whilst 'lifetime expected credit losses' are recognised for the second category. The Group does not have any material expected credit losses.
Measurement of the expected credit losses is determined by a probability-weighted estimate of credit losses over the expected life of the financial instrument.
The Group makes use of a simplified approach in accounting for trade and other receivables and records the loss allowance as lifetime expected credit losses. These are the expected shortfalls in contractual cash flows, considering the potential for default at any point during the life of the financial instrument. In calculating, the Group uses its historical experience, external indicators, and forward-looking information to calculate the expected credit losses using a provision matrix.
|
23 FINANCIAL INSTRUMENTS (continued)
Accounting Policy (continued)
|
Classification and measurement of financial liabilities The Group's financial liabilities include borrowings, trade and other payables and derivative financial instruments.
Financial liabilities are initially measured at fair value, and where applicable, adjusted for transaction costs unless the Group designated a financial liability at fair value through profit or loss.
Subsequently, financial liabilities are initially measured at amortised cost using the effective interest method except for derivatives and financial liabilities designation at FVTPL, which are carried subsequently at fair value with gains or losses recognised in profit or loss.
All interest-related charges and, if applicable, changes in an instrument's fair value that are reported in profit or loss are included within finance costs or finance income.
Derivative financial instruments Derivative financial instruments are accounted for at fair value through profit and loss (FVTPL).
|
Capital risk management
The Group manages its capital to ensure that entities in the Group will be able to continue as a going concern while maximising the return to shareholders through the optimisation of the debt and equity balance.
The Group's overall strategy remains unchanged from 2024.
The capital structure of the Group consists of cash and cash equivalents, borrowings, and equity attributable to equity holders of the parent, comprising issued capital, reserves and retained earnings.
None of the Group's entities are subject to externally imposed capital requirements.
Operating cash flows are used to maintain and expand operations, as well as to make routine expenditures such as tax and general administrative outgoings.
Financial risk management objectives
The Group is exposed to market risk (including foreign currency exchange rate risk and interest rate risk), credit risk and liquidity risk.
The Group's risk management policies are established to identify and analyse the risks faced by the Group, to set appropriate risk limits and controls, and to monitor risks and adherence to limits. Risk management policies and systems are reviewed on a continuous basis to reflect changes in market conditions and the Group's activities. The Group does not trade financial instruments, including derivative financial instruments, for speculative purposes.
23 FINANCIAL INSTRUMENTS (continued)
Market risk
The Group's activities expose it primarily to the financial risks of changes in interest rates.
There has been no change to the Group's exposure to market risks or the manner it manages and measures the risk from the previous period.
Interest rate risk management
The Group is exposed to interest rate risk as entities in the Group borrow funds at both fixed and floating interest rates. The risk is managed by the Group by maintaining an appropriate mix between fixed and floating rate borrowings.
The Group's exposure to interest rate on financial assets and financial liabilities are detailed in the liquidity risk management section of this note.
Interest rate risk sensitivity analysis
The sensitivity analysis below has been determined based on the exposure to interest rates for non-derivative instruments at the balance date.
At balance date, if interest rates had been 100 points higher or lower and all other variables were held constant, the Group's profit or loss would increase / (decrease) by $9,931.
The Group's sensitivity to interest rates has increased during the year mainly due to the increase in cash held.
Credit risk management
Credit risk is the risk that a counterparty fails to discharge an obligation to the Group. The Group is exposed to credit risk from financial assets including cash and cash equivalents held at banks and trade and other receivables.
The Group has adopted a policy of only dealing with creditworthy counterparties.
The Group only transacts with entities that are rated the equivalent of investment grade and above. This information is supplied by independent rating agencies where available and, if not available, the Group uses publicly available financial information and its own trading record to rate its customers.
The Group's exposure and the credit ratings of its counterparties are continuously monitored, and the aggregate value of transactions concluded is spread amongst approved counterparties.
The Group does not have any significant credit risk exposure to any single counterparty or any group of counterparties having similar characteristics. The credit risk on liquid funds is limited because the counterparties are banks or government agencies with high credit ratings assigned by international credit rating agencies.
The carrying amount of financial assets recorded in the financial statements, represents the Group's maximum exposure to credit risk.
23 FINANCIAL INSTRUMENTS (continued)
Liquidity risk management
Ultimate responsibility for liquidity risk management rests with the Board of Directors, who have built an appropriate liquidity risk management framework for the management of the Group's short, medium, and long-term funding and liquidity management requirements.
The Group manages liquidity risk by maintaining adequate banking and borrowing facilities by continuously monitoring forecast and actual cash flows and matching the maturity profiles of financial assets and liabilities.
Non-derivative financial liabilities
The following table details the Group's expected contractual maturities for its non-derivative financial liabilities.
These have been drawn up based on undiscounted contractual maturities of the financial liabilities based on the earliest date the Group can be required to repay.
The table include both interest and principal cash flows.
|
|
|
|
|
|
|
|
|
|
|
|
|
|
|
|
|
|
|
|
|
|
|
|
|
30 June 2025 |
|
|
|
|
|
|
|
Trade and other payables |
n/a |
691,943 |
520,492 |
- |
1,212,435 |
|
|
Right-of-use lease liabilities |
5.40 |
60,000 |
60,000 |
50,000 |
170,000 |
|
|
|
n/a |
751,943 |
580,492 |
50,000 |
1,382,435 |
|
|
|
|
|
|
|
|
|
|
30 June 2024 |
|
|
|
|
|
|
|
Trade and other payables |
n/a |
814,514 |
520,492 |
- |
1,335,006 |
|
|
Right-of-use lease liabilities |
|
47,792 |
- |
- |
47,792 |
|
|
|
n/a |
862,306 |
520,492 |
- |
1,382,798 |
|
23 FINANCIAL INSTRUMENTS (continued)
Fair value measurement
Financial assets and financial liabilities measured at fair value in the statement of financial position are grouped into three levels of a fair value hierarchy.
The three levels are defined based on the observability of significant inputs to the measurement, as follows:
· Level 1: quoted prices (unadjusted) in active markets for identical assets or liabilities
· Level 2: inputs other than quoted prices included within Level 1, that are observable for the asset or liability, either directly (as prices) or indirectly (derived from prices); and
· Level 3: inputs for the asset or liability that are not based on observable market data (unobservable inputs).
The carrying amounts of all financial assets and liabilities recognised in the financial statements approximate their fair values other than those disclosed below:
|
|
|
|
|
|
|
|
|
|
|
|
|
|
|
|
Listed shares (8,625,000 / 6,750,000) |
1 |
448,500 |
1,080,800 |
|
Unlisted options (937,500, Black-Scholes valuation) |
3 |
19,969 |
- |
|
|
|
468,469 |
1,080,800 |
|
|
|
|
|
Not measured at fair value
The Group has various financial instruments which are not measured at fair value on a recurring basis in the statement of financial position.
The Directors consider that the carrying amounts of current receivables, current payables and current borrowings are a reasonable approximation to their fair values.
The methods and valuation techniques used for the purposes of measuring fair values are unchanged compared to the previous reporting period.
24 RELATED PARTIES
Accounting Policy
|
Key management personnel compensation Directors' remuneration is expensed as the related service is provided. A liability is recognised for the amount expected to be paid if the Group has a present legal or constructive obligation to pay this amount because of past service provided by the employee and the obligation can be estimated reliably.
|
(a) Key management personnel compensation
Key management personnel compensation comprises the following:
|
|
|
|
|
|
|
|
|
|
|
|
|
|
|
|
Short-term employee benefits |
|
537,255 |
500,471 |
|
Post-employment benefits |
|
20,125 |
6,238 |
|
Share-based payments - shares |
|
25,000 |
- |
|
Share-based payments - options |
|
141,915 |
- |
|
|
|
724,295 |
506,709 |
|
|
|
|
|
(b) Other key management personnel transactions
Several key management personnel, or their related parties, hold positions in other companies that result in them having control or significant influence over these companies.
A number of these companies transacted with the Group during the year. The terms and conditions of these transactions were no more favourable than those available, or which might reasonably be expected to be available, in similar transactions to non-key management personnel related companies on an arm's length basis.
Integrated CFO Solutions, a company for which
Royal Corporate Services Pty Ltd, a company for which
Royal Corporate Services Pty Ltd, a company for which
25 AUDITOR'S REMUNERATION
|
|
|
|
|
|
|
|
|
|
|
|
|
|
|
|
HLB Mann Judd |
|
|
|
|
Audit and other assurance services |
|
|
|
|
Audit and review of financial reports |
|
59,828 |
64,000 |
|
Taxation compliance services |
|
7,000 |
10,000 |
|
Total Auditor's Remuneration |
|
66,828 |
74,000 |
|
|
|
|
|
26 SUBSIDIARIES
The consolidated financial statements incorporate the assets, liabilities, and results of the following wholly owned subsidiary in accordance with the accounting policy described in note 1.4:
|
|
|
|
|
|
|
|
|
|
|
|
|
|
|
|
|
|
|
|
|
|
|
100 |
100 |
|
KML No2 Pty Ltd |
|
100 |
100 |
|
|
|
100 |
100 |
|
Artemis Management Services Pty Ltd |
|
100 |
100 |
|
|
|
100 |
100 |
|
Elysian Resources Pty Ltd |
|
100 |
100 |
|
Hard Rock Resources Pty Ltd |
|
100 |
100 |
|
Artemis Graphite Pty Ltd |
|
100 |
100 |
|
|
|
|
|
|
|
|
|
|
Balances and transactions between the Company and its subsidiary, which is a related party of the Company, have been eliminated on consolidation.
27 PARENT COMPANY DISCLOSURES
Accounting Policy
|
The accounting policies of the parent entity, which has been applied in determining the financial information shown below, are the same as those applied in the consolidated financial statements.
|
As at, and throughout the financial year ended 30 June 2025, the parent entity of the Group was
|
|
|
|
|
|
|
|
|
|
|
Result of the parent entity |
|
|
|
|
Loss for the year |
|
(5,324,531) |
(6,459,561) |
|
Total comprehensive loss for the year |
|
(5,324,531) |
(6,459,561) |
|
|
|
|
|
|
Financial position of parent entity at year end |
|
|
|
|
Current assets |
|
1,764,251 |
1,812,367 |
|
Total assets |
|
4,960,383 |
4,793,420 |
|
|
|
|
|
|
Current liabilities |
|
1,349,721 |
1,336,704 |
|
Total liabilities |
|
1,399,226 |
1,384,498 |
|
|
|
|
|
|
Total equity of the parent entity comprising of: |
|
|
|
|
Share capital |
|
125,661,826 |
120,237,759 |
|
Equity-settled benefits reserve |
|
962,137 |
499,111 |
|
Accumulated losses |
|
(123,062,806) |
(117,327,948) |
|
Total equity |
|
3,561,157 |
3,408,922 |
|
|
|
|
|
The parent entity did not have any contingent liabilities or commitments as at 30 June 2025 (2024: nil).
28 CAPITAL AND OTHER COMMITMENTS
Exploration expenditure commitments
To maintain current rights of tenure to exploration tenements, the Group is required to perform minimum exploration work to meet the requirements specified by the State Government. These obligations are not provided for in the financial statements and are payable as follows:
|
|
|
|
|
|
|
|
|
|
|
Mineral exploration |
|
|
|
|
Less than one year |
|
639,400 |
747,330 |
|
Between one year and five years |
|
1,374,400 |
2,094,187 |
|
Greater than five years |
|
99,100 |
287,177 |
|
|
|
2,112,900 |
3,128,694 |
|
|
|
|
|
29 CONTINGENT LIABILITIES AND ASSETS
As at 30 June 2025, the Group is not aware of any contingent liabilities or contingent assets (2024: nil).
30 MATTERS SUBSEQUENT TO THE END OF THE FINANCIAL YEAR
The Company announced and completed a capital raise of $4.925 million post year end, issuing 1,231,249,999 shares at $0.004 each.
The Company appointed Mr
No other matters or circumstances have arisen since the end of the financial year that have significantly affected, or may significantly affect, the operations of the Group, the results of these operations, or the state of affairs of the Group in future financial years.
CONSOLIDATED ENTITY DISCLOSURE STATEMENT
As at 30 June 2025
Basis of preparation
The consolidated entity disclosure statement has been prepared in accordance with s295(3A)(a) of the Corporations Act 2001 and includes the required information for
Tax Residency
S295(3A)(vi) of the Corporations Act 2001 defines tax residency as having the meaning in the Income Tax Assessment Act 1997. The determination of tax residency may involve judgement as there are different interpretations that could be adopted, and which could give risk to different conclusions regarding residency.
In determining tax residency, the Group has applied the following interpretations:
Australian Tax Residency
Current legislation and judicial precedent have been applied, including having regard to the Tax Commissioner's public guidance.
Foreign Tax Residency
Where appropriate, independent tax advisers have been engaged to assist in the determination of tax residence to ensure applicable foreign tax legislation has been complied with.
|
|
|
|
|
|
|
Parent Entity |
|
|
|
|
|
|
Body Corporate |
|
n/a |
Australian |
|
|
|
|
|
|
|
Subsidiaries: |
|
|
|
|
|
Fox Radio Hill Pty Limited |
Body Corporate |
|
100% |
Australian |
|
Karratha Metals Limited |
Body Corporate |
|
100% |
Australian |
|
|
Body Corporate |
|
100% |
Australian |
|
|
Body Corporate |
|
100% |
Australian |
|
Elysian Resources Pty Limited |
Body Corporate |
|
100% |
Australian |
|
Hard Rock Resources Pty Limited |
Body Corporate |
|
100% |
Australian |
|
Artemis Graphite Pty Ltd |
Body Corporate |
|
100% |
Australian |
|
Artemis Management Services Pty Ltd |
Body Corporate |
|
100% |
Australian |
|
Andover Lithium Pty Ltd |
|
|
50% |
Australian |
|
At the end of the financial year, no entity within the consolidated entity was a trustee of a trust within the consolidated entity, a partner in a partnership within the consolidated entity, or a participant in a joint venture within the consolidated entity. |
||||
|
|
|
|
|
|
DIRECTORS' DECLARATION
In accordance with a resolution of the Directors of
In the directors' opinion:
1. The financial statements and notes comply with the Corporations Act 2001, the Accounting Standards, the Corporations Regulations 2001, and other mandatory professional reporting requirements.
2. The attached financial statements and notes comply with International Financial Reporting Standards as issued by the
3. The financial statements and notes give a true and fair view of the Group's financial position as of 30 June 2025 and of its performance for the financial year ended on that date.
4. There are reasonable grounds to believe that the Company will be able to pay its debts as and when they become due and payable.
5. The Consolidated Entity Disclosure Statement on page 81 is true and correct.
This declaration has been made after receiving the declarations required to be made to the Directors in accordance with section 295A of the Corporations Act 2001 for the year ended 30 June 2025.
On behalf of the Board
Executive Chairman
26 September 2025
RNS may use your IP address to confirm compliance with the terms and conditions, to analyse how you engage with the information contained in this communication, and to share such analysis on an anonymised basis with others as part of our commercial services. For further information about how RNS and the London Stock Exchange use the personal data you provide us, please see our Privacy Policy.