
("
INTERIM RESULTS FOR THE SIX MONTHS ENDED 30 JUNE 2025
Record first half with full-year outlook enhanced by the acquisition of TRC Advisory
Financial Highlights
· 35% increase in revenue compared to H1 24, with revenue totalling
· Organic revenue growth of 17% compared to H1 24
· 42% increase in adjusted EBITDA [1] compared to H1 24, totalling
· 38% increase in adjusted profit before tax ('PBT') [1], totalling
· 35% increase in adjusted diluted earnings per share ('EPS') [1] compared to H1 24, totalling 29.0p (H1 24: 21.5p)
· 12% increase in free cash flow compared to H1 24, totalling
Key highlights include:
|
|
H1 25 |
H1 24 |
Change |
|
Revenue |
|
|
+35% |
|
Adjusted EBITDA [1] |
|
|
+42% |
|
Adjusted EBITDA margin |
30.0% |
28.5% |
+1.5pp |
|
Adjusted profit before tax [1] |
|
|
+38% |
|
Adjusted diluted EPS [1] |
29.0p |
21.5p |
+35% |
[1] In order to provide better clarity to the underlying performance of the Group,
Operating Highlights
· In H1 25,
· We continued to unlock additional value from previous acquisitions, achieving
· The number of £1m+ clients increased from 22 in H1 24 to 31 in H1 25 [3], demonstrating
· We have maintained strong momentum across all four pillars of our growth strategy (stretch existing Partners, hire Partners, promote Partners and acquire complementary businesses), highlighting the demand for
o Revenue per Partner increased 8% to
o We strengthened our Partner team with key external Partner hires, bringing decades of consulting and industry expertise across the US and
o Notable internal promotions included
o We have today separately announced the acquisition of US strategy firm,
· We were again recognised on
·
[2] MCA - Growth Forecast: Average consulting market revenue growth forecast of 3.6% from 2024 to 2025, in comparison to
[3] On a 12-month trailing basis.
Current Trading and Outlook
The Board remains confident in delivering organic FY 25 trading results in line with market expectations and enhanced by the acquisition of TRC Advisory.
Commenting on the results,
"H1 25 has been an exceptional and transformative period for
"Our entrepreneurial mindset and ambition to push the boundaries of what's possible has driven a series of impressive firsts for the firm. Our successful move from AIM to the Main Market of the
"As we broaden our market access through our growing client base and targeted acquisitions, we remain focused on helping our clients navigate their most critical challenges. With our acquisition of TRC Advisory, we are well-positioned to unlock even greater opportunities for our clients, shareholders and our team in the years ahead."
Enquiries:
For enquiries, please refer to our Investor Contacts page:
https://www.elixirr.com/investors/investor-contacts
Stephen Newton, Chief Executive Officer
Graham Busby, Deputy Chief Executive Officer
Nick Willott, Chief Financial Officer
investor-relations@elixirr.com
Sunila de Silva (ECM)
Notes to editors
Elixirr is an award-winning global consulting firm working with clients across a diverse range of industries, markets and geographies. Founded in 2009, the firm set out to be the 'challenger consultancy' and do things differently than the large corporate consultancies dominating the industry: working openly and collaboratively with clients from start to finish, delivering outcomes based on innovative thinking, not methodology, and treating each client's business like their own. Elixirr was quoted on the AIM market of the
This announcement contains inside information for the purposes of Article 7 of the Market Abuse Regulation (EU) 596/2014 as it forms part of UK domestic law by virtue of the
Disclaimer
This announcement contains certain statements that are, or may be, forward looking statements with respect to the financial condition, results of operations, business achievements and/or investment strategy of the Company. Such forward looking statements are based on the Board's expectations of external conditions and events, current business strategy, plans and the other objectives of management for future operations, and estimates and projections of the Company's financial performance. Though the Board believes these expectations to be reasonable at the date of this document they may prove to be erroneous. Forward looking statements involve known and unknown risks, uncertainties and other factors which may cause the actual results, achievements or performance of the Group, or the industry in which the Group operates, to be materially different from any future results, achievements or performance expressed or implied by such forward looking statements.
INTERIM MANAGEMENT REPORT
Financial Performance Review
|
|
H1 25 |
H1 24 |
Change |
|
Revenue |
|
|
+35% |
|
Gross profit |
|
|
+40% |
|
Adjusted EBITDA [1] |
|
|
+42% |
|
Adjusted EBITDA margin |
30.0% |
28.5% |
+1.5pp |
|
Adjusted profit before tax [1] |
|
|
+38% |
|
Adjusted diluted EPS [1] |
29.0p |
21.5p |
+35% |
|
Net cash/(debt) |
( |
|
N/A |
|
Free cash flow |
|
|
+12% |
[1] In order to provide better clarity to the underlying performance of the Group, Elixirr uses adjusted EBITDA, adjusted PBT and adjusted EPS as alternative performance measures ('APMs'). Please refer to note 2 of the Group's interim condensed consolidated financial statements.
The Board is pleased to report that the Group delivered a strong performance in H1 25, demonstrating continued growth in revenue and adjusted EBITDA, in line with our ambition to build the best consultancy in the world, focused on the technology of tomorrow. We have continued to provide our clients with a broad portfolio of exceptional services, capitalising on the recent acquisition of Hypothesis and the Partners hired and promoted in FY 24.
During H1 25, Group revenue increased to
The following revenue bridge displays the elements of the growth in revenue from
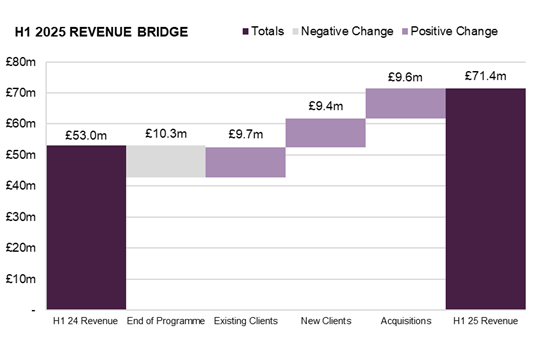
The Group's revenue growth was supported by continued profitability. Group gross profit increased by 40% to
EBITDA growth resulted in a 38% increase in adjusted profit before tax to
Net debt of
Net assets as at
Operational Review
During the first half of FY 25, Elixirr capitalised on its diverse Group-wide offering to deliver outstanding client outcomes, deepening existing partnerships and building new relationships. Highlights include:
· Increased cross-sell across the Group, achieving
· Scaled relationships with existing clients, growing our 'gold clients' (clients with £1m+ revenue) by 41% whilst simultaneously generating new client relationships
· Hosted Elixirr's inaugural Capital Markets Day, highlighting our work and differentiated approach across AI, digital, data and technology. The event provided investors with the opportunity to engage directly with the Partners delivering this work and to hear candid perspectives directly from our senior clients
· Held the
· Became the Official Digital Transformation Partner to both British Cycling and Gravel Burn, with a mandate to overhaul data and digital ecosystems and develop scalable platforms to significantly enhance the athlete and fan experience
· Celebrated our second cohort of graduates from our
During the period, we implemented the following Board and Executive changes: Ian Ferguson stepped down from the Board to become a Board Advisor and Elixirr announced the appointment of Graham Busby as Deputy CEO and Nick Willott as CFO. Nick also joined the Board with effect from
In H1 25, we helped our clients tackle a variety of challenges, including:
· Embarking on a global ERP transformation across 140 countries with a
· Partnering with a multinational facilities company to design and implement a new IT target operating model, strategy and execution roadmap, accelerating business-critical initiative delivery by 40% and boosting stakeholder satisfaction by 35% through consistent prioritisation
· Working with a leading non-profit to bridge the digital gap across its processes for assessing and implementing charitable initiatives, designing a target state platform to replace manual, disconnected workflows, unlocking greater efficiency, transparency, collaboration and human connection
· Defining a three-horizon roadmap with 50+ initiatives across data, AI and analytics for a major US retail & consumer goods company seeking to remain competitive in a data-driven market
Elixirr has been acknowledged in H1 25 through multiple awards and accolades, including:
· Recognised on the World's Best Management Consulting Firms list and America's Best Management Consulting Firms list by Forbes for 2025
· Listed as one of the
· Recognised by Consultancy.UK as a Top Consulting Firm in the UK, earning platinum and gold rankings in twelve service areas, including Strategy, Data Science, Management and Innovation
· Listed on the Global Outsourcing 100® in 2025, the annual list of the world's best outsourcing service providers and advisors compiled by the
Growth Strategy
Elixirr's growth strategy remains focused on maximising the potential of existing Partners, promoting internal talent, attracting new Partners, and pursuing strategic acquisitions to enhance capability and market presence.
1. Stretching our existing Partners
As part of its organic growth approach, Elixirr has continued to focus on increasing the performance and revenue contribution of its existing Partner team. In H1 25, revenue per Partner increased by 8% from
2. Promoting Partners from within
In
Elixirr also announced two more Partner promotions, effective
Of Elixirr's current Partner team, thirteen have been promoted from the Principal grade. Growing our own talent is also key to our future success, and we have remained focused on developing Principal talent during the first half of the year with both hiring at this grade externally as well as promoting Managers into the Principal grade.
3. Hiring new Partners
We have continued to progress our third growth pillar, hiring two new Partners so far in 2025.
Stuart Stern joined us in H1 25, bringing over 30 years of experience across both consulting and industry. Stuart has held senior leadership roles at Slalom, AWS and Accenture, leading major transformation programmes and complex cloud migrations for some of the world's largest companies. He has also served as VP of IT Strategy & Delivery at a Fortune 500 utility and pipeline company, and as Americas CIO at Allianz Global Corporate & Specialty, leading a major divestiture.
Conrad Troy also joined us in H1 25. Conrad is a digital transformation and ERP leader, previously holding senior roles at Deloitte, Infosys and KPMG, where he built and led global SAP practices, delivering major business transformation programmes across industries. He brings deep expertise in ERP strategy, AI integration, and creating transformation business cases that drive growth, efficiency and improved client outcomes.
In addition, we continue to build a pipeline of future Partner hires in key strategic focus areas and geographies.
4. Acquiring new businesses
During H1 25, we were very pleased with the performance of our most recent acquisitions, Insigniam (acquired
Acquiring top-quality businesses remains a key priority of our growth strategy. Looking across all our acquisitions saw the creation of additional value for our clients in H1 25, with
Post-period Events
1. Admission to Main Market
The transition from AIM to the Main Market of the
2. Increased Debt Facilities
On
3. Acquisition
On
Outlook
The Board remains confident in delivering organic FY 25 trading results in line with market expectations and enhanced by the acquisition of TRC Advisory.
Gavin Patterson Stephen Newton
Chairman Chief Executive Officer
Principal Risks and Uncertainties
Consistent with other consulting and advisory businesses, we are exposed to a range of risks which, if not managed effectively, could impact our ability to deliver on our strategic objectives and may adversely affect our performance.
We have assessed our key risks, which are consistent with those outlined in our Prospectus published
We regularly review our risk management framework to ensure it reflects the evolving nature of our business and the markets in which we operate.
Directors' Responsibility Statement
The Directors confirm, to the best of their knowledge, that the condensed consolidated set of financial statements has been prepared in accordance with International Accounting Standard 34 'Interim Financial Reporting' as adopted by the United Kingdom and that the interim management report includes a fair review of the information required by:
· DTR 4.2.7R of the Disclosure Guidance and Transparency Rules, being an indication of important events that have occurred during the first six months of the financial year and their impact on the condensed set of financial statements, and a description of the principal risks and uncertainties for the remaining six months of the financial year; and
· DTR 4.2.8R of the Disclosure Guidance and Transparency Rules, being related party transactions that have taken place in the first six months of the current financial year and that have materially affected the financial position or the performance of the Group during that period; and any changes in the related party transactions described in the Annual Report 2024 that could do so.
By order of the Board
Stephen Newton Graham Busby Nicholas Willott
Chief Executive Officer Deputy Chief Executive Officer Chief Financial Officer
Interim Condensed Consolidated Statement of Comprehensive Income
For the six months ended
|
|
|
Six months ended Unaudited |
|
Six months ended Unaudited |
|
|
Note |
£'000s |
|
£'000s |
|
|
|
|
|
|
|
|
|
|
|
|
|
Revenue |
|
71,410 |
|
53,034 |
|
Cost of sales |
|
(47,086) |
|
(35,684) |
|
Gross profit |
|
24,324 |
|
17,350 |
|
|
|
|
|
|
|
Administrative expenses |
|
(7,431) |
|
(5,065) |
|
Operating profit before M&A and Main Market-related items |
|
16,893 |
|
12,285 |
|
|
|
|
|
|
|
Depreciation |
|
881 |
|
710 |
|
Amortisation of intangible assets |
|
1,496 |
|
1,031 |
|
Share-based payments |
13 |
2,188 |
|
1,112 |
|
Adjusted EBITDA |
|
21,458 |
|
15,138 |
|
|
|
|
|
|
|
M&A-related items |
4 |
(161) |
|
(15) |
|
Main Market listing costs |
4 |
(795) |
|
- |
|
Operating profit |
|
15,937 |
|
12,270 |
|
Net finance expense |
|
(578) |
|
(252) |
|
Profit before tax |
|
15,359 |
|
12,018 |
|
Taxation |
|
(4,343) |
|
(3,179) |
|
|
|
|
|
|
|
Profit for the period |
|
11,016 |
|
8,839 |
|
|
|
|
|
|
|
Exchange differences on translation of foreign operations |
|
(5,630) |
|
166 |
|
|
|
|
|
|
|
Total comprehensive income for the period |
|
5,386 |
|
9,005 |
|
|
|
|
|
|
|
Basic earnings per Ordinary Share (p) |
5 |
23.2 |
|
18.9 |
|
Diluted earnings per Ordinary Share (p) |
5 |
21.3 |
|
17.1 |
|
Adjusted basic earnings per Ordinary Share (p) |
5 |
31.7 |
|
23.7 |
|
Adjusted diluted earnings per Ordinary Share (p) |
5 |
29.0 |
|
21.5 |
All results relate to continuing operations.
The notes form part of these interim condensed consolidated financial statements.
Interim Condensed Consolidated Statement of Financial Position
As at 30 June 2025
|
|
|
As at 30 June 2025 Unaudited |
|
As at 31 December 2024 Audited |
|
As at 30 June 2024 Unaudited |
|
|
Note |
£'000s |
|
£'000s |
|
£'000s |
|
Assets |
|
|
|
|
|
|
|
Non-current assets |
|
|
|
|
|
|
|
Intangible assets |
6 |
123,738 |
|
130,334 |
|
100,335 |
|
Property, plant and equipment |
|
4,428 |
|
4,927 |
|
4,941 |
|
Other receivables |
7 |
3,013 |
|
3,023 |
|
1,968 |
|
Loans to shareholders |
7 |
9,093 |
|
7,399 |
|
7,316 |
|
Deferred tax asset |
|
4,177 |
|
3,830 |
|
4,147 |
|
Total non-current assets |
|
144,449 |
|
149,513 |
|
118,707 |
|
|
|
|
|
|
|
|
|
Current assets |
|
|
|
|
|
|
|
Trade and other receivables |
7 |
22,880 |
|
18,385 |
|
17,839 |
|
Corporation tax receivable |
|
- |
|
467 |
|
- |
|
Cash and cash equivalents |
|
2,844 |
|
7,527 |
|
22,148 |
|
Total current assets |
|
25,724 |
|
26,379 |
|
39,987 |
|
|
|
|
|
|
|
|
|
Total assets |
|
170,173 |
|
175,892 |
|
158,694 |
|
|
|
|
|
|
|
|
|
Liabilities |
|
|
|
|
|
|
|
Current liabilities |
|
|
|
|
|
|
|
Trade and other payables |
8 |
26,641 |
|
25,675 |
|
20,481 |
|
Loans and borrowings |
10 |
1,129 |
|
1,530 |
|
1,197 |
|
Corporation tax |
|
108 |
|
- |
|
382 |
|
Other creditors |
9 |
3,457 |
|
5,564 |
|
4,405 |
|
Total current liabilities |
|
31,335 |
|
32,769 |
|
26,465 |
|
|
|
|
|
|
|
|
|
Non-current liabilities |
|
|
|
|
|
|
|
Loans and borrowings |
10 |
13,024 |
|
3,366 |
|
3,588 |
|
Deferred tax liability |
|
3,350 |
|
3,632 |
|
2,132 |
|
Other non-current liabilities |
9 |
2,348 |
|
4,012 |
|
3,940 |
|
Total non-current liabilities |
|
18,722 |
|
11,010 |
|
9,660 |
|
|
|
|
|
|
|
|
|
Total liabilities |
|
50,057 |
|
43,779 |
|
36,125 |
|
|
|
|
|
|
|
|
|
Net assets |
|
120,116 |
|
132,113 |
|
122,569 |
|
|
|
|
|
|
|
|
|
Equity |
|
|
|
|
|
|
|
Share capital |
11 |
52 |
|
52 |
|
52 |
|
Share premium |
11 |
33,702 |
|
33,702 |
|
29,557 |
|
Capital redemption reserve |
|
2 |
|
2 |
|
2 |
|
EBT share reserve |
12 |
(9,641) |
|
(2,897) |
|
(2,001) |
|
Merger relief reserve |
11 |
46,870 |
|
46,870 |
|
46,870 |
|
Foreign currency translation reserve |
|
(4,176) |
|
1,457 |
|
544 |
|
Retained earnings |
|
53,307 |
|
52,927 |
|
47,545 |
|
Total shareholders' equity |
|
120,116 |
|
132,113 |
|
122,569 |
Interim Condensed Consolidated Statement of Changes in Equity
For the six months ended 30 June 2025
|
|
Share capital £'000s |
Share premium £'000s |
Capital redemption reserve £'000s |
EBT share reserve |
Merger relief reserve £'000s |
Foreign currency translation reserve £'000s |
Retained earnings £'000s |
Total £'000s |
|
|
|
|
|
|
|
|
|
|
|
As at 31 December 2023 and 01 January 2024 |
52 |
29,922 |
2 |
(1,745) |
46,870 |
378 |
44,083 |
119,562 |
|
|
|
|
|
|
|
|
|
|
|
Comprehensive income |
|
|
|
|
|
|
|
|
|
Profit for the period |
- |
- |
- |
- |
- |
- |
8,839 |
8,839 |
|
Other comprehensive income |
- |
- |
- |
- |
- |
166 |
- |
166 |
|
|
|
|
|
|
|
|
|
|
|
Transactions with owners |
|
|
|
|
|
|
|
|
|
Dividends |
- |
- |
- |
- |
- |
- |
(6,907) |
(6,907) |
|
Share-based payments |
- |
- |
- |
- |
- |
- |
960 |
960 |
|
Deferred tax recognised in equity |
- |
- |
- |
- |
- |
- |
570 |
570 |
|
Sale of Ordinary Shares |
- |
(365) |
- |
1,295 |
- |
- |
- |
930 |
|
Acquisition of Ordinary Shares |
- |
- |
- |
(1,551) |
- |
- |
- |
(1,551) |
|
|
|
|
|
|
|
|
|
|
|
As at 30 June 2024 |
52 |
29,557 |
2 |
(2,001) |
46,870 |
544 |
47,545 |
122,569 |
|
|
|
|
|
|
|
|
|
|
|
Comprehensive income |
|
|
|
|
|
|
|
|
|
Profit for the period |
- |
- |
- |
- |
- |
- |
7,540 |
7,540 |
|
Other comprehensive income |
- |
- |
- |
- |
- |
913 |
- |
913 |
|
|
|
|
|
|
|
|
|
|
|
Transactions with owners |
|
|
|
|
|
|
|
|
|
Ordinary Share issues |
- |
6,402 |
- |
- |
- |
- |
- |
6,402 |
|
Share-based payments |
- |
- |
- |
- |
- |
- |
1,061 |
1,061 |
|
Deferred tax recognised in equity |
- |
- |
- |
- |
- |
- |
(726) |
(726) |
|
Current tax recognised in equity |
- |
- |
- |
- |
- |
- |
1,419 |
1,419 |
|
Sale of Ordinary Shares |
- |
(2,257) |
- |
9.616 |
- |
- |
(3,912) |
3,447 |
|
Acquisition of Ordinary Shares |
- |
- |
- |
(10,512) |
- |
- |
- |
(10,512) |
|
|
|
|
|
|
|
|
|
|
|
As at 31 December 2024 and 01 January 2025 |
52 |
33,702 |
2 |
(2,897) |
46,870 |
1,457 |
52,927 |
132,113 |
|
|
|
|
|
|
|
|
|
|
|
Comprehensive income |
|
|
|
|
|
|
|
|
|
Profit for the period |
- |
- |
- |
- |
- |
- |
11,016 |
11,016 |
|
Other comprehensive income |
- |
- |
- |
- |
- |
(5,633) |
- |
(5,633) |
|
|
|
|
|
|
|
|
|
|
|
Transactions with owners |
|
|
|
|
|
|
|
|
|
Dividends |
- |
- |
- |
- |
- |
- |
(8,400) |
(8,400) |
|
Share-based payments |
- |
- |
- |
- |
- |
- |
1,894 |
1,894 |
|
Deferred tax recognised in equity |
- |
- |
- |
- |
- |
- |
227 |
227 |
|
Current tax recognised in equity |
- |
- |
- |
- |
- |
- |
714 |
714 |
|
Sale of Ordinary Shares |
- |
- |
- |
11,356 |
- |
- |
(5,071) |
6,285 |
|
Acquisition of Ordinary Shares |
- |
- |
- |
(18,101) |
- |
- |
- |
(18,101) |
|
|
|
|
|
|
|
|
|
|
|
As at 30 June 2025 |
52 |
33,702 |
2 |
(9,641) |
46,870 |
(4,176) |
53,307 |
120,116 |
|
|
|
|
|
|
|
|
|
|
Share capital
Share capital represents the nominal value of share capital subscribed.
Share premium
The share premium account is used to record the aggregate amount or value of premiums paid when the Company's shares are issued at a premium, net of associated share issue costs.
Capital redemption reserve
The capital redemption reserve is a non-distributable reserve into which amounts are transferred following the redemption or purchase of the Company's own shares.
EBT share reserve
The Employee Benefit Trust ('EBT') share reserve represents the cost of shares repurchased and held in the EBT.
Merger relief reserve
This reserve records the amounts above the nominal value received for shares sold, less transaction costs in accordance with section 610 of the Companies Act 2006.
Foreign currency translation reserve
The foreign currency translation reserve represents exchange differences that arise on consolidation from the translation of the financial statements of foreign subsidiaries.
Retained earnings
The retained earnings reserve represents cumulative net gains and losses recognised in the statement of comprehensive income and equity-settled share-based payment reserves and related tax on share-based payments.
Interim Condensed Consolidated Statement of Cash Flows
For the six months ended 30 June 2025
|
|
|
Six months ended 30 June 2025 Unaudited |
|
Six months ended 30 June 2024 Unaudited |
|
|
Note |
£'000s |
|
£'000s |
|
Cash flows from operating activities: |
|
|
|
|
|
Cash generated from operations |
15 |
11,731 |
|
10,650 |
|
Taxation paid |
|
(2,984) |
|
(3,018) |
|
Net cash generated from operating activities |
|
8,747 |
|
7,632 |
|
|
|
|
|
|
|
Cash flows from investing activities: |
|
|
|
|
|
Purchase of property, plant and equipment |
|
(32) |
|
(32) |
|
Software development costs |
|
(117) |
|
(132) |
|
Payment for acquisition of subsidiary, net of cash acquired |
|
(4,752) |
|
(162) |
|
Interest received |
|
100 |
|
191 |
|
Net cash utilised in investing activities |
|
(4,801) |
|
(135) |
|
|
|
|
|
|
|
Cash flows from financing activities: |
|
|
|
|
|
EBT Ordinary share purchases |
|
(17,956) |
|
(1,796) |
|
EBT Ordinary share sales |
|
5,878 |
|
1,295 |
|
Loans to shareholders |
|
(2,350) |
|
(500) |
|
Loans repaid by shareholders |
|
550 |
|
765 |
|
Proceeds from borrowings |
|
18,782 |
|
- |
|
Repayment of borrowings |
|
(9,078) |
|
- |
|
Interest and transaction costs paid on borrowings |
|
(334) |
|
- |
|
Ordinary share dividends paid to shareholders |
|
(3,007) |
|
(2,485) |
|
Lease liability payments |
|
(703) |
|
(536) |
|
Interest paid |
|
(126) |
|
(123) |
|
Net cash utilised in financing activities |
|
(8,344) |
|
(3,380) |
|
|
|
|
|
|
|
Net (decrease)/increase in cash and cash equivalents |
|
(4,398) |
|
4,117 |
|
|
|
|
|
|
|
Cash and cash equivalents at beginning of the period |
|
7,527 |
|
18,130 |
|
Effects of exchange rate changes on cash and cash equivalents |
|
(285) |
|
(99) |
|
Cash and cash equivalents at the end of the period |
|
2,844 |
|
22,148 |
|
|
|
|
|
|
|
|
|
|
|
|
|
|
|
|
|
|
Notes to the Group's Interim Condensed Consolidated Financial Statements
1. Basis of Preparation and Significant Accounting Policies
1.1. General information
Elixirr International plc (the "Company") and its subsidiaries' (together the "Group") principal activities are the provision of consultancy services.
The Company is a public company limited by shares incorporated in England and Wales and domiciled in the UK. The share capital of the Company is listed on the London Stock Exchange. The address of the registered office is 12 Helmet Row, London, EC1V 3QJ and the Company number is 11723404.
The consolidated financial statements were authorised for issue in accordance with a resolution of the Directors on 19 September 2025.
1.2. Basis of preparation
These condensed consolidated financial statements have been prepared in accordance with UK-adopted International Accounting Standards (IAS) 34 'Interim Financial Reporting'. They do not include all disclosures that would otherwise be required in a complete set of financial statements and should be read in conjunction with the Annual Report 2024. The financial information for the half years ended 30 June 2025 and 30 June 2024 do not constitute statutory accounts within the meaning of Section 434(3) of the Companies Act 2006 and are unaudited.
The annual financial statements of Elixirr International plc are prepared in accordance with UK-adopted International Accounting Standards. The comparative financial information for the year ended 31 December 2024 included within this report does not constitute the full statutory accounts for that period. The Annual Report 2024 has been filed with the Registrar of Companies. The Independent Auditor's Report on the Annual Report 2024 was unqualified, did not draw attention to any matters by way of emphasis, and did not contain a statement under section 498(2) and 498(3) of the Companies Act 2006.
The accounting policies adopted are consistent with those of the previous financial year except for income tax expense, which is recognised based on management's estimate of the weighted average effective annual income tax rate expected for the full financial year. They are consistent with those of the corresponding interim reporting period.
1.3. Basis of consolidation
These financial statements consolidate the financial statements of the Company and its subsidiary undertakings as at 30 June 2025.
Subsidiaries are fully consolidated from the date of acquisition, being the date on which the Group obtains control, and continue to be consolidated until the date that such control ceases. The acquisition method of accounting has been adopted. The financial statements of subsidiaries are prepared for the same reporting period as the parent company, using consistent accounting policies.
All intra-group balances, income and expenses and unrealised gains and losses resulting from intra-group transactions are eliminated in full.
1.4. Measurement convention
These financial statements have been prepared under the historical cost convention, except as otherwise described in the accounting policies.
The preparation of the consolidated financial information in compliance with IFRS requires the use of certain critical accounting estimates and management judgements in applying the accounting policies. The significant estimates and judgements that have been made and their effect is disclosed in note 1.6.1.
1.5. Going concern
The Directors have, at the time of approving the financial statements, a reasonable expectation that the Company and the Group have adequate resources to continue in operation for the foreseeable future. The Group's forecasts and projections, taking into account reasonable possible changes in trading performance, show that the Group has sufficient financial resources, together with assets that are expected to generate cash flow in the normal course of business. Accordingly, the Directors have adopted the going concern basis in preparing these consolidated financial statements.
1.6. Material accounting policies
Please refer to the Group's last annual consolidated financial statements for full disclosure of the principal accounting policies that have been adopted in the preparation of these interim condensed consolidated financial statements. There have been no new accounting standards or policies adopted during the period that have had a material impact on the Group. The key accounting policies that affected the Group in the period are set out below.
1.6.1. Judgements and key sources of estimation uncertainty
The preparation of the financial statements requires management to make estimates and judgements that affect the reported amounts of assets, liabilities, costs and revenue in the financial statements. Actual results could differ from these estimates. The judgements, estimates and associated assumptions are based on historical experience and other factors that are considered to be relevant.
In the process of applying the Group's accounting policies, the Directors have made judgements which are considered to have a significant effect on the amounts recognised in the financial statements for the period ending 30 June 2025. These judgements involve estimations for contingent consideration on acquisitions and the recognition of intangibles on acquisitions, including applying the Multi-period Excess Earnings method to estimate the fair value of customer relationships and order books.
The key sources of estimation uncertainty that could cause an adjustment to be required to the carrying amount of assets or liabilities within the next accounting period is contingent consideration arising on business combinations under IFRS 3. Contingent consideration contains estimation uncertainty as the earn-out potentially payable is linked to the future performance of the acquiree. In estimating the fair value of the contingent consideration, at both the acquisition date and the period end, management has estimated the potential future cash flows of the acquirees and assessed the likelihood of an earn-out payment being made. These estimates could potentially change as a result of events over the coming years.
1.6.2. Revenue recognition
Revenue is measured as the fair value of consideration received or receivable for satisfying performance obligations contained in contracts with clients, excluding discounts and Value Added Tax. Variable consideration is included in revenue only to the extent that it is highly probable that a significant reversal will not be required when the uncertainties determining the level of variable consideration are resolved.
This occurs as follows for the Group's various contract types:
· Time-and-materials contracts are recognised over time as services are provided at the fee rate agreed with the client where there is an enforceable right to payment for performance completed to date.
· Fixed-fee contracts are recognised over time based on the actual service provided to the end of the reporting period as a proportion of the total services to be provided where there is an enforceable right to payment for performance completed to date. This is determined based on the actual inputs of time and expenses relative to total expected inputs.
Where contracts include multiple performance obligations, the transaction price is allocated to each performance obligation based on its stand-alone selling price. Where these are not directly observable, they are estimated based on expected cost-plus margin. Adjustments are made to allocate discounts proportionately relative to the stand-alone selling price of each performance obligation.
Estimates of revenues, costs or extent of progress toward completion are revised if circumstances change. Any resulting increase or decrease in estimated revenues or costs are reflected in the statement of comprehensive income in the period in which the circumstances that give rise to the revision became known.
Fees are normally billed on a monthly basis. If the revenue recognised by the Group exceeds the amounts billed, a contract asset is recognised. If the amounts billed exceed the revenue recognised, a contract liability is recognised. Unbilled revenue is recognised at the fair value of consultancy services provided at the reporting date reflecting the stage of completion (determined by costs incurred to date as a percentage of the total anticipated costs) of each assignment. Contract assets are reclassified as receivables when billed and the consideration has become unconditional because only the passage of time is required before payment is due.
The Group's standard payment terms require settlement of invoices within 30 days of receipt.
The Group does not adjust the transaction price for the time value of money as it does not expect to have any contracts where the period between the transfer of the promised services to the client and the payment by the client exceeds one year.
1.6.3. Business combinations, goodwill and consideration
Business combinations
The Group applies the acquisition method of accounting to account for business combinations in accordance with IFRS 3, 'Business Combinations'.
The consideration transferred for the acquisition of a subsidiary is the fair value of the assets transferred, the liabilities incurred and the equity interests issued by the Group. The consideration transferred includes the fair value of any asset or liability resulting from a contingent consideration arrangement. Identifiable assets acquired and liabilities and contingent liabilities assumed in a business combination are measured initially at their fair values at the acquisition date. The excess of the consideration transferred over the fair value of the Group's share of the identifiable net assets acquired is recorded as goodwill. All transaction related costs are expensed in the period they are incurred as operating expenses. If the consideration is lower than the fair value of the net assets of the subsidiary acquired, the difference is recognised in the income statement.
Goodwill
Goodwill is initially measured at cost and any previous interest held over the net identifiable assets acquired and liabilities assumed. If the fair value of the net assets acquired is in excess of the aggregate consideration transferred, the Group re-assesses whether it has correctly identified all of the assets acquired and all of the liabilities assumed and reviews the procedures used to measure the amounts to be recognised at the acquisition date. If the reassessment still results in an excess of the fair value of net assets acquired over the aggregate consideration transferred, then the gain is recognised in the income statement.
After initial recognition, goodwill is measured at cost less any accumulated impairment losses. For the purposes of impairment testing, goodwill is allocated to each of the Group's cash-generating units expected to benefit from the synergies of the combination. Cash-generating units to which goodwill has been allocated are tested for impairment annually, or more frequently when there is an indication that the unit may be impaired.
The Group performs impairment reviews at the reporting period end to identify any goodwill or intangible assets that have a carrying value that is in excess of its recoverable amount. Determining the recoverability of goodwill and the intangible assets requires judgement in both the methodology applied and the key variables within that methodology. Where it is determined that an asset is impaired, the carrying value of the asset will be reduced to its recoverable amount with the difference recorded as an impairment charge in the income statement.
Contingent and non-contingent deferred consideration on acquisition
Contingent and non-contingent deferred consideration may arise on acquisitions. Non-contingent deferred consideration may arise when settlement of all or part of the cost of the business combination falls due after the acquisition date. Contingent deferred consideration may arise when the consideration is dependent on future performance of the acquired company.
Deferred consideration associated with business combinations settled in cash is assessed in line with the agreed contractual terms. Consideration payable is recognised as capital investment cost when the deferred or contingent consideration is not employment-linked. Alternatively, consideration is recognised as remuneration expense over the deferral or contingent performance period, where the consideration is also contingent upon future employment. Where the contingent consideration is settled in a variable number of shares or cash, the consideration is classified as a liability and measured at fair value through profit and loss.
1.6.4. Foreign currency translation
The presentational currency of these financial statements and the functional currency of the Group is pounds sterling.
Functional and presentational currency
Items included in the financial statements of each of the Group's entities are measured using the currency of the primary economic environment in which the entity operates ('the functional currency'). The financial statements are presented in 'sterling', which is the Group's and Company's functional currency and presentation currency.
On consolidation, the results of overseas operations are translated into sterling at rates approximating to those ruling when the transactions took place. All assets and liabilities of overseas operations are translated at the rate ruling at the reporting date. Exchange differences arising on translating the opening net assets at opening rate and the results of overseas operations at actual rate are recognised in other comprehensive income.
Transactions and balances
Foreign currency transactions are translated into the functional currency using the exchange rates prevailing at the dates of the transactions. Foreign exchange gains and losses resulting from the settlement of such transactions and from the translation at year-end exchange rates of monetary assets and liabilities denominated in foreign currencies are recognised in the income statement.
1.6.5. Intangible assets
Intangible assets are measured at cost less accumulated amortisation and any accumulated impairment losses.
Software development
Expenditure on software development activities is recognised as an intangible asset when the Group can demonstrate: the technical feasibility of completing the software so that it will be available for use or sale; its intention to complete and its ability to use or sell the asset; how the asset will generate future economic benefits; the availability of resources to complete the asset; and the ability to reliably measure the expenditure during development. Capitalised software development costs are amortised on a straight-line basis over the estimated useful life of 3 years.
The cost of such intangible assets is the fair value at the acquisition date. All intangible assets acquired through business combinations are amortised over their estimated useful lives. The significant intangibles recognised by the Group, their useful economic lives and the methods used to determine the cost of the intangibles acquired in business combinations are as follows:
|
Intangible Asset |
Useful Economic Life |
Valuation Method |
|
Trademark |
33.33% reducing balance |
Relief from Royalty method |
|
Customer relationships |
10 - 25% reducing balance |
Multi-Period Excess Earnings method |
|
Order book |
Over order term |
Multi-Period Excess Earnings method |
1.6.6. Tangible assets
Tangible fixed assets are stated at cost net of accumulated depreciation and accumulated impairment losses.
Costs comprise purchase costs together with any incidental costs of acquisition.
Depreciation is provided to write down the cost less the estimated residual value of all tangible fixed assets by equal instalments over their estimated useful economic lives on a straight-line basis. The following rates are applied:
|
Tangible fixed asset |
Useful economic life |
|
Leasehold improvements |
Over the life of the lease |
|
Computer equipment |
3 years |
|
Fixtures and fittings |
3 years |
The assets' residual values, useful lives and depreciation methods are reviewed, and adjusted prospectively if appropriate, if there is an indication of a significant change since the last reporting date. Low value equipment including computers is expensed as incurred.
1.6.7. Impairments of tangible and intangible assets
At each reporting end date, the Group reviews the carrying amounts of its tangible and intangible assets (other than goodwill) to determine whether there is any indication that those assets have suffered an impairment loss. If any such indication exists, the recoverable amount of the asset is estimated in order to determine the extent of the impairment loss (if any). Where it is not possible to estimate the recoverable amount of an individual asset, the Group estimates the recoverable amount of the cash-generating unit to which the asset belongs.
The recoverable amount is the higher of fair value less costs to sell and value in use. In assessing value in use, the estimated future cash flows are discounted to their present value using a pre-tax discount rate that reflects current market assessments of the time value of money and the risks specific to the asset for which the estimates of future cash flows have not been adjusted.
If the recoverable amount of an asset (or cash-generating unit) is estimated to be less than its carrying amount, the carrying amount of the asset (or cash-generating unit) is reduced to its recoverable amount. An impairment loss is recognised immediately in profit and loss.
Where an impairment subsequently reverses, the carrying amount of the asset (or cash-generating unit) is increased to the revised estimate of its recoverable amount, but so that the increased carrying amount does not exceed the carrying amount that would have been determined had no impairment loss been recognised for the asset (or cash-generating unit) in prior years. A reversal of an impairment loss is recognised immediately in profit and loss.
1.6.8. Employee benefits
Post-retirement benefits
The Group pays into defined contribution pension schemes on behalf of employees, which are operated by third parties. The assets of the schemes are held separately from those of the Group in independently administered funds.
The amount charged to the income statement represents the contributions payable to the scheme in respect of the accounting period.
Share-based payments
The cost of share-based employee compensation arrangements, whereby employees receive remuneration in the form of equity instruments, is recognised as an employee benefit expense in the statement of profit and loss.
The total expense to be apportioned over the vesting period of the benefit is determined by reference to the fair value (excluding the effect of non-market based vesting conditions) at the grant date. For share option and employee share purchase plans fair value is measured by use of Black Scholes option valuation model.
At the end of each reporting period the assumptions underlying the number of awards expected to vest are adjusted for the effects of non-market based vesting conditions to reflect conditions prevailing at that date. The impact of any revisions to the original estimates is recognised in the statement of profit or loss, with a corresponding adjustment to equity.
The Group has the obligation to pay employers' national insurance on the exercise of certain UK employee options. The Group has opted to account for the tax obligation under IFRS 2 as a cash-settled share-based payment arrangement as the amount of employers' national insurance due at the time of exercise is based on the share price of the equity instruments of the Company. The cash-settled share-based payment liability is estimated at each period end using the closing share price of the Company and the prevailing employers' national insurance rate. The number of awards expected to vest are consistent with the treatment for equity-settled share-based payments. The cost of employers' national insurance is included within share-based payments expense in the statement of comprehensive income.
Please refer to note 13 for further details.
1.6.9. Earnings per share
The Group presents basic and diluted earnings per share on both a statutory and adjusted basis.
Basic EPS is calculated by dividing the profit attributable to the Group's Ordinary shareholders by the weighted average number of Ordinary shares outstanding during the period.
The calculation of diluted EPS assumes conversion of all potentially dilutive Ordinary shares. For share options, a calculation is performed to determine the number of share options that are potentially dilutive based on the number of shares that could have been acquired at fair value from the future assumed proceeds of the outstanding share options.
2. Alternative Performance Measures ('APMs')
In order to provide better clarity to the underlying performance of the Group, Elixirr uses adjusted EBITDA, adjusted PBT and adjusted EPS as alternative performance measures. These measures are not defined under IFRS. These non-GAAP measures are not intended to be a substitute for, or superior to, any IFRS measures of performance, but have been included as the Directors consider adjusted EBITDA, adjusted PBT and adjusted EPS to be key measures used within the business for assessing the underlying performance of the Group's ongoing business across periods.
Adjusted EBITDA excludes the following items from operating profit: non-cash depreciation and amortisation charges, share-based payments and non-recurring M&A and Main Market-related items. Adjusted PBT excludes the following items from profit before tax: amortisation charges, share-based payments, non-recurring M&A and Main Market-related items and M&A-related non-cash finance costs. Adjusted EPS excludes the following items from profit after tax: amortisation charges, share-based payments, non-recurring M&A and Main Market-related items, M&A-related non-cash finance costs and their related tax impacts.
The table below sets out the reconciliation of the Group's adjusted EBITDA and adjusted profit before tax from profit before tax:
|
|
H1 25 |
H1 24 |
|
|
|
£'000s |
£'000s |
|
|
Profit before tax |
15,359 |
12,018 |
|
|
Adjusting items: |
|
|
|
|
M&A-related items (note 4) |
161 |
15 |
|
|
Main Market listing costs (note 4) |
795 |
- |
|
|
Amortisation of intangible assets |
1,496 |
1,031 |
|
|
Share-based payments |
2,188 |
1,112 |
|
|
Finance cost - contingent consideration |
136 |
367 |
|
|
Adjusted profit before tax |
20,135 |
14,543 |
|
|
Depreciation |
881 |
710 |
|
|
Net finance cost/(income) (excluding contingent consideration) |
442 |
(115) |
|
|
Adjusted EBITDA |
21,458 |
15,138 |
|
The table below sets out the reconciliation of the Group's adjusted profit after tax to adjusted profit before tax:
|
|
H1 25 |
H1 24 |
|
|
£'000s |
£'000s |
|
Adjusted profit before tax |
20,135 |
14,543 |
|
Tax charge |
(4,343) |
(3,179) |
|
Tax impact of adjusting items |
(778) |
(272) |
|
Adjusted profit after tax |
15,014 |
11,092 |
Adjusted profit after tax is used in calculating adjusted basic and adjusted diluted EPS. Adjusted profit after tax is stated before adjusting items and their associated tax effects.
Adjusted EPS is calculated by dividing the adjusted profit after tax for the period attributable to Ordinary shareholders by the weighted average number of Ordinary shares outstanding during the period. Adjusted diluted EPS is calculated by dividing adjusted profit after tax by the weighted average number of shares adjusted for the impact of potential Ordinary shares.
Potential Ordinary shares are treated as dilutive when their conversion to Ordinary shares would decrease EPS. Please refer to note 5 for further detail.
|
|
H1 25 |
H1 24 |
|
|
P |
p |
|
Adjusted EPS |
31.7 |
23.7 |
|
Adjusted diluted EPS |
29.0 |
21.5 |
3. Segmental Reporting
IFRS 8 requires that operating segments be identified on the basis of internal reporting and decision-making. The Group is operated as one global business by its executive team, with key decisions being taken by the same leaders irrespective of the geography where work for clients is carried out. The Directors therefore consider that the Group has one operating segment. As such, no additional disclosure has been recorded under IFRS 8.
4. M&A and Main Market-related items
|
|
H1 25 |
H1 24 |
|
|
£'000s |
£'000s |
|
M&A-related items: |
|
|
|
- Transaction costs |
10 |
15 |
|
- Employment-related contingent consideration |
151 |
- |
|
Main Market listing costs |
795 |
- |
5. Earnings Per Share
The Group presents non-adjusted and adjusted basic and diluted EPS for its Ordinary shares. Basic EPS is calculated by dividing the profit for the period attributable to Ordinary shareholders by the weighted average number of Ordinary shares outstanding during the period.
Diluted EPS takes into consideration the Company's dilutive contingently issuable shares. The weighted average number of Ordinary shares used in the diluted EPS calculation is inclusive of the number of share options and ESPP matching awards that are expected to vest (subject to performance criteria being met) and the number of shares that may be issued to satisfy contingent M&A deferred consideration.
The profits and weighted average number of shares used in the calculations are set out below:
|
|
H1 25 |
H1 24 |
|
Basic and Diluted EPS |
|
|
|
|
|
|
|
Profit attributable to the Ordinary equity holders of the Group used in calculating basic and diluted EPS (£'000s) |
11,016 |
8,839 |
|
Basic earnings per Ordinary share (p) |
23.2 |
18.9 |
|
Diluted earnings per Ordinary share (p) |
21.3 |
17.1 |
|
|
|
|
|
|
H1 25 |
H1 24 |
|
Adjusted Basic and Diluted EPS |
|
|
|
|
|
|
|
Profit attributable to the ordinary equity holders of the Group used in calculating adjusted basic and diluted EPS (note 2) (£'000s) |
15,014 |
11,092 |
|
Adjusted basic earnings per Ordinary share (p) |
31.7 |
23.7 |
|
Adjusted diluted earnings per Ordinary share (p) |
29.0 |
21.5 |
|
|
|
|
|
|
H1 25 |
H1 24 |
|
|
Number |
Number |
|
Weighted average number of shares |
|
|
|
|
|
|
|
Weighted average number of ordinary shares used as the denominator in calculating non-adjusted and adjusted basic EPS |
47,437,162 |
46,850,312 |
|
Number of dilutive Ordinary shares |
4,335,596 |
4,735,999 |
|
Weighted average number of ordinary shares used as the denominator in calculating non-adjusted and adjusted diluted EPS |
51,772,758 |
51,586,311 |
6. Goodwill and Intangible Fixed Assets
|
|
Goodwill |
Trademarks |
Customer Relationships |
Order Book |
Software |
Total |
|
|
£'000s |
£'000s |
£'000s |
£'000s |
£'000s |
£'000s |
|
Cost |
|
|
|
|
|
|
|
At 31 December 2023 and 01 January 2024 |
93,661 |
7,135 |
5,939 |
1,548 |
433 |
108,716 |
|
Additions |
- |
- |
- |
- |
172 |
172 |
|
Gains/(losses) from foreign exchange |
263 |
- |
28 |
10 |
(3) |
298 |
|
At 30 June 2024 |
93,924 |
7,135 |
5,967 |
1,558 |
602 |
109,186 |
|
Acquisition of business |
24,658 |
- |
4,666 |
752 |
- |
30,076 |
|
Additions |
- |
- |
- |
- |
70 |
70 |
|
Gains from foreign exchange |
947 |
- |
203 |
39 |
64 |
1,253 |
|
At 31 December 2024 |
119,529 |
7,135 |
10,836 |
2,349 |
736 |
140,585 |
|
Measurement period adjustment |
1,274 |
- |
- |
- |
- |
1,274 |
|
At 31 December 2024 (restated) |
120,803 |
7,135 |
10,836 |
2,349 |
736 |
141,859 |
|
Additions |
- |
- |
- |
- |
78 |
78 |
|
Losses from foreign exchange |
(5,812) |
- |
(756) |
(198) |
(60) |
(6,826) |
|
At 30 June 2025 |
114,991 |
7,135 |
10,080 |
2,151 |
754 |
135,111 |
|
|
|
|
|
|
|
|
|
Amortisation |
|
|
|
|
|
|
|
At 31 December 2023 and 01 January 2024 |
- |
(5,577) |
(1,392) |
(842) |
- |
(7,811) |
|
Charge for the period |
- |
(241) |
(441) |
(305) |
(44) |
(1,031) |
|
Gains/(losses) from foreign exchange |
- |
- |
(7) |
(5) |
3 |
(9) |
|
At 30 June 2024 |
- |
(5,818) |
(1,840) |
(1,152) |
(41) |
(8,851) |
|
Charge for the period |
- |
(206) |
(676) |
(403) |
(72) |
(1,357) |
|
Losses from foreign exchange |
- |
- |
(23) |
(17) |
(3) |
(43) |
|
At 31 December 2024 |
- |
(6,024) |
(2,539) |
(1,572) |
(116) |
(10,251) |
|
Charge for the period |
- |
(172) |
(868) |
(354) |
(102) |
(1,496) |
|
Gains from foreign exchange |
- |
- |
212 |
152 |
11 |
375 |
|
At 30 June 2025 |
- |
(6,196) |
(3,196) |
(1,774) |
(207) |
(11,373) |
|
|
|
|
|
|
|
|
|
Net book value |
|
|
|
|
|
|
|
At 30 June 2024 |
93,924 |
1,317 |
4,127 |
406 |
561 |
100,335 |
|
At 31 December 2024 |
119,529 |
1,111 |
8,297 |
777 |
620 |
130,334 |
|
At 30 June 2025 |
114,991 |
939 |
6,884 |
377 |
547 |
123,738 |
Goodwill
Goodwill arising on the acquisition of a business in FY 24 relates to the acquisition of Hypothesis and was calculated as the fair value of initial consideration paid less the fair value of the net identifiable assets at the date of the acquisition.
As set out in the FY 24 annual report, the contingent consideration amount recognised at 31 December 2024 for Hypothesis was estimated and pending finalisation. During H1 25 the amount was finalised and agreed with the sellers of Hypothesis, resulting in an adjustment to the fair value of the contingent consideration payable. As a result of this, the table above shows the corresponding measurement period adjustment to goodwill.
In line with IAS 36, the carrying value of goodwill is not subject to systematic amortisation but is reviewed at least annually for impairment. The Group performs an annual impairment assessment. At 30 June 2025, the Directors determined that there are no indications that the assets held are at risk of impairment.
Customer Relationships and Order Book
Additions in FY 24 represent the fair value of customer relationships and the order book from the acquisition of Hypothesis.
The fair values were determined by applying the Multi-Period Excess Earnings method. The amortisation charge is recognised within administrative expenses.
7. Receivables
|
|
H1 25 |
FY 24 |
|
|
£'000s |
£'000s |
|
Non-current assets |
|
|
|
Loans to shareholders |
9,093 |
7,399 |
|
Other receivables |
3,013 |
3,023 |
|
|
12,106 |
10,422 |
|
Current assets |
|
|
|
Trade receivables |
19,001 |
15,665 |
|
Less: allowance for doubtful debts |
- |
(42) |
|
Trade receivables - net |
19,001 |
15,623 |
|
Prepayments and deposits |
2,478 |
1,939 |
|
Contract assets |
1,390 |
804 |
|
Other receivables |
11 |
19 |
|
|
22,880 |
18,385 |
|
|
|
|
Loans to shareholders represent amounts owed to the Company by shareholders, who are senior employees of the Group. The loans to shareholders are interest-free and expected to be repaid beyond one year. Non-current other receivables include property deposits and s455 tax receivable.
The carrying value of non-current other receivables and loans to shareholders is considered to be a reasonable approximation of their fair value, but has not been discounted to present value.
Trade receivables are non-interest bearing and receivable under normal commercial terms. Management considers that the carrying value of trade and other receivables approximates to their fair value. The expected credit loss on trade and other receivables was not material at the current or prior period ends.
8. Trade and Other Payables
|
|
H1 25 |
FY 24 |
|
|
£'000s |
£'000s |
|
Trade payables |
2,781 |
2,293 |
|
Other taxes and social security costs |
1,628 |
1,590 |
|
Accruals |
10,671 |
14,536 |
|
Dividend payable |
5,393 |
- |
|
Contract liabilities |
5,431 |
6,369 |
|
Other payables |
737 |
887 |
|
|
26,641 |
25,675 |
The fair value of trade and other payables approximates to book value at the period end. Trade payables are non-interest bearing and are normally settled monthly.
Trade payables comprise amounts outstanding for trade purchases and ongoing costs.
Contract liabilities arise from the Group's revenue generating activities relating to payments received in advance of performance delivered under a contract. These contract liabilities typically arise on short-term timing differences between performance obligations in some milestone or fixed fee contracts and their respective contracted payment schedules.
9. Other Creditors and Other Non-current Liabilities
|
|
H1 25 |
FY 24 |
|
|
£'000s |
£'000s |
|
|
|
|
|
Other creditors |
|
|
|
Contingent consideration |
3,318 |
5,558 |
|
Employment-related contingent consideration |
137 |
6 |
|
|
3,455 |
5,564 |
|
|
|
|
|
Other non-current liabilities |
|
|
|
Dilapidations |
330 |
373 |
|
Cash-settled share-based payments |
913 |
724 |
|
Contingent consideration |
1,106 |
2,915 |
|
|
2,349 |
4,012 |
Contingent consideration in H1 25 includes earn-out payments which are contingent on performance and arose from the acquisition of Elixirr Digital Inc, Elixirr AI, Insigniam and Hypothesis.
The employment-related contingent consideration includes post-acquisition employee benefits in relation to the Hypothesis acquisition.
Cash-settled share-based payments include obligations for the Group's employers' NI on options that are yet to vest. Refer to note 13 for further details.
Other non-current liability payments fall due beyond 12 months from the reporting date.
10. Loans and Borrowings
|
|
H1 25 |
FY 24 |
|
|
£'000s |
£'000s |
|
|
|
|
|
Current liabilities |
|
|
|
Right of use lease liability |
1,129 |
1,530 |
|
|
1,129 |
1,530 |
|
|
|
|
|
Non-current liabilities |
|
|
|
Right of use lease liability |
3,352 |
3,366 |
|
Revolving credit facility |
9,672 |
- |
|
|
13,024 |
3,366 |
During FY 24 the Group agreed a £45 million revolving credit facility with National Westminster Bank Plc to support delivery of the Group's organic and inorganic growth strategy.
At 30 June 2025 the Group had £35.3 million of the facility unutilised.
Revolving credit facility at 30 June 2025:
|
Currency |
Amount |
Rate |
|
|
£'000s |
% |
|
GBP |
9,672 |
SONIA + margin % |
|
USD |
- |
SOFR + margin % |
The margin rate ranges from 1.95% to 2.60% and is dependent on leverage.
11. Share capital, Share premium and Merger Relief Reserve
|
|
H1 25 & FY 24 |
|||
|
|
Issued shares |
Par value |
Merger relief reserve |
Share premium |
|
|
Number |
£ |
£'000s |
£'000s |
|
£0.00005 Ordinary shares |
48,187,415 |
2,409 |
46,870 |
33,702 |
|
£1 Redeemable Preference shares |
50,001 |
50,001 |
- |
- |
|
|
48,237,416 |
52,410 |
46,870 |
33,702 |
The total number of voting rights in the Company at 30 June 2025 was 48,187,415.
Ordinary shares
On a show of hands every holder of Ordinary shares present at a meeting, in person or by proxy, is entitled to one vote, and on a poll each share is entitled to one vote. The shares entitle the holder to participate in dividends, and to share in the proceeds of winding up the Company in proportion to the number of and amounts paid on the shares held. These rights are subject to the prior entitlements of the Redeemable Preference shareholders.
Redeemable Preference shares
The Redeemable Preference shares are entitled to dividends at a rate of 1% per annum of paid-up nominal value. The shares have preferential right, before any other class of share, to a return of capital on winding-up or reduction of capital or otherwise of the Company. The Redeemable Preference shares are redeemable 100 years from the date of issue or at any time prior at the option of the Company.
12. Employee Benefit Trust ('EBT') Share Reserve
The EBT is accounted for under IFRS 10 and is consolidated on the basis that the parent has control, thus the assets and liabilities of the EBT are included in the Group statement of financial position and shares held by the EBT in the Company are presented as a deduction from equity.
The EBT share reserve comprises of Ordinary and Redeemable Preference shares bought and held in the Group's EBT.
The below table sets out the number of EBT shares held and their weighted average cost:
|
|
H1 25 |
||
|
|
Shares held in EBT |
Weighted average cost |
Total cost |
|
|
Number |
£ |
£'000s |
|
Ordinary shares |
1,291,767 |
7.42 |
9,591 |
|
Redeemable Preference shares |
50,001 |
1.01 |
50 |
|
|
1,341,768 |
|
9,641 |
|
|
|
|
|
|
|
|
|
|
|
|
FY 24 |
||
|
|
Shares held in EBT |
Weighted average cost |
Total cost |
|
|
Number |
£ |
£'000s |
|
Ordinary shares |
483,823 |
5.88 |
2,846 |
|
Redeemable Preference shares |
50,001 |
1.01 |
50 |
|
|
533,824 |
|
2,897 |
13. Share-based Payments
Share Option Plans
The Group operates EMI, CSOP and unapproved share option plans with time-based and performance-based vesting conditions.
During H1 25, a total of 2,006,784 (H1 24: 2,000,392) share options were granted to employees and senior management. The weighted average fair value of the options awarded in the period is £2.13 (H1 24: £1.68) per share.
Details of share option awards made are as follows:
|
|
Number of share options (000's) |
Weighted average exercise price (£) |
|
Outstanding at 31 December 2024 |
12,753 |
4.71 |
|
Granted |
2,007 |
8.13 |
|
Exercised |
(166) |
1.53 |
|
Forfeited |
(373) |
5.66 |
|
Outstanding at 30 June 2025 |
14,221 |
5.20 |
|
Exercisable at 30 June 2025 |
1,701 |
3.15 |
For the options exercised during H1 25, the weighted average share price at the date of exercise was £7.34.
The options outstanding at 30 June 2025 had a weighted average remaining contractual life of 2.4 years (H1 24: 2.5 years) and a weighted average exercise price of £5.20 (H1 24: £4.08) per share.
The options were fair valued at the grant date using the Black Scholes option valuation model. The inputs into the model were as follows:
|
|
H1 25 |
H1 24 |
|
Weighted average share price at grant date (£) |
7.89 |
5.63 |
|
Weighted average exercise price (£) |
8.13 |
5.82 |
|
Volatility (%) |
38.2% |
38.8% |
|
Weighted average vesting period (years) |
4.6 |
4.5 |
|
Risk free rate (%) |
4.1% |
4.0% |
|
Expected dividend yield (%) |
3.3% |
2.3% |
Expected volatility was determined by calculating the historic volatility of the Company's share price. The expected expense calculated in the model has been adjusted, based on management's best estimate, for the effects of non-market-based performance conditions and employee attrition.
Reasonable changes in the above inputs do not have a material impact on the share-based payment charge in H1 25.
Employee Share Purchase Plan ('ESPP')
The Group operates an employee share purchase plan where the employees of the Group (excluding Partners) are eligible to contribute a percentage of their gross salary to purchase shares in the Company. The Company makes a matching award of shares that will vest over time dependent on continued employment.
During H1 25, the Company awarded 202,139 (H1 24: 233,690) matching shares on the basis of one matching share for every one employee share purchased during FY 24. The matching shares vest equally over a 5-year period with the first tranche vesting on 31 January 2026.
Details of ESPP awards made are as follows:
|
|
Number of ESPP awards (000's) |
|
Outstanding at 31 December 2024 |
341 |
|
Granted |
202 |
|
Vested and converted to shares |
(77) |
|
Forfeited |
(39) |
|
Outstanding at 30 June 2025 |
427 |
|
Exercisable at 30 June 2025 |
- |
Restricted Share Awards ('RSA')
During H1 25 the Company granted restricted share awards to Graham Busby, Deputy Chief Executive Officer, and Nick Willott, Chief Financial Officer, to further align the incentives of the executive management team with growing shareholder value.
The restricted share awards were granted in respect of Ordinary Shares, comprising 476,000 shares to Graham and 135,870 to Nick. The share awards remain subject to forfeiture conditions during the vesting period to 31 December 2027. Until then, the legal title to the shares is held by the Elixirr International Employee Benefit Trust ('EBT') on behalf of the beneficiaries. Vesting is subject to the continued tenure of each executive during the vesting term and the achievement of adjusted diluted EPS targets.
14. Ordinary Dividends
An interim Ordinary share dividend in respect of the financial year ended 31 December 2024 of 6.3 pence per Ordinary share was paid on 17 February 2025.
The Board proposed a final Ordinary share dividend in respect of the financial year ended 31 December 2024 of 11.5 pence per Ordinary share, which was approved by shareholders at the Annual General Meeting in June 2025, and paid on 20 August 2025.
15. Cash Flow Information
Cash generated from operations:
|
|
H1 25 |
H1 24 |
|
|
£'000s |
£'000s |
|
Profit before taxation |
15,359 |
12,018 |
|
Adjustments for: |
|
|
|
Depreciation and amortisation |
2,377 |
1,741 |
|
Net finance expense |
578 |
252 |
|
Share-based payments |
2,129 |
1,056 |
|
Employment-related contingent consideration |
151 |
- |
|
Increase in trade and other receivables |
(4,409) |
(1,292) |
|
Decrease in trade and other payables |
(4,718) |
(3,068) |
|
Foreign exchange losses/(gains) |
264 |
(57) |
|
|
11,731 |
10,650 |
16. Related Party Disclosures
Related parties, following the definitions in IAS 24, are the Group's subsidiary companies, members of the Board, key management personnel and their families, and shareholders who have control or significant influence over the Group.
In H1 25, travel costs include £14,182 (H1 24: £6,470) for the hire of an aeroplane from Aviation E LLP. Stephen Newton, a member of the Board, is a member of Aviation E LLP.
In H1 25, revenue includes £58,797 (H1 24: Nil) for services performed for Cape Point Guest Lodges (Pty) Ltd and £12,681 (H1 24: £3,707) for services performed for Cape Point Wine (Pty) Ltd. Stephen Newton, a member of the Board, is a Director of both Cape Point Guest Lodges (Pty) Ltd and Cape Point Wine (Pty) Ltd.
17. Events After the Reporting Date
As disclosed in note 4, costs of £0.8m related to listing on the Main Market of the London Stock Exchange were recognised in H1 25. Following the reporting date, the Company completed its listing on the Main Market on 1 July 2025. Total costs of the Main Market listing were £1.5m including the amount recognised in H1 25.
On 20 August 2025 the Company paid the final Ordinary share dividend in respect of the financial year ended 31 December 2024. The amount paid of £5.4m represented 11.5 pence per Ordinary share.
On 18 September 2025, Elixirr agreed an increase in its revolving credit facility with National Westminster Bank plc from £45m to £65m and the option of a US$20.25m term loan to support delivery of the Group's organic and inorganic growth strategy, whilst limiting equity dilution.
On 19 September 2025, the Group acquired all the issued and outstanding membership interests of TRC, a US-based growth strategy consultancy firm, enhancing the firm's capabilities in strategy, go-to-market models, pricing disciplines and resource productivity. TRC brings deep expertise in the industrials and manufacturing sectors, working with leading organisations to deliver measurable business impact and significantly strengthening Elixirr's presence in these markets.
The Group acquired TRC for a maximum enterprise value of US$125m, which consists of:
· Initial consideration of US$41m payable in cash, subject to customary completion adjustments and holdbacks;
· Initial consideration of US$16m to be satisfied by issuing 1,428,526 Elixirr International plc Ordinary shares at a price of £8.20 per share;
· Contingent consideration of up to US$68m, comprised of:
o Top-up consideration of up to US$32m, to be determined by 30 April 2026 and, if earned, based on the achievement of agreed FY 25 EBITDA performance targets, will be payable up to US$24m in cash and up to US$8m to be satisfied by the issue of further Ordinary shares.
o Earn-out consideration of up to US$36m, payable over three years (FY 26, FY 27 and FY 28) in three instalments, at the Company's discretion, either in cash or through the issue of further Ordinary shares.
Disclosure of the amounts recognised as of the acquisition date for each major class of assets acquired and liabilities assumed, fair value adjustments and goodwill on the acquisition of TRC has not been made given the limited amount of time available between the acquisition date and the date this interim report was authorised for issue.
As at 19 September 2025, in accordance with the Financial Conduct Authority's Disclosure and Transparency Rules, the Company has 49,615,941 Ordinary shares in issue, of which none are held in Treasury. The total number of voting rights in the Company is 49,615,941. This figure of 49,615,941 may be used by shareholders in the Company as the denominator for the calculations by which they will determine if they are required to notify their interest in, or a change in their interest in, the share capital of the Company under the FCA's Disclosure and Transparency Rules.
RNS may use your IP address to confirm compliance with the terms and conditions, to analyse how you engage with the information contained in this communication, and to share such analysis on an anonymised basis with others as part of our commercial services. For further information about how RNS and the London Stock Exchange use the personal data you provide us, please see our Privacy Policy.