

('Keystone', the 'Group' or the 'Company')
Interim Results for the six months ended
- Expecting FY 2026 revenue and adjusted PBIT to be ahead and adjusted PBT comfortably ahead of current market expectations(1)
- Recruitment conditions remained positive, with Keystone adding 30 new Principals ongoing growth in Pods
- Interim dividend of 7.5p, reflecting balance sheet strength and confidence in the outlook
Keystone, the tech-enabled platform law firm, is pleased to announce its interim results for the six months ended
Financial Highlights:
· Revenue growth of 16.5% to
· Revenue per Principal up 9.9% to
· Adjusted PBIT up 11.2% to
· Adjusted PBT up 20.4% to
· Adjusted basic EPS of 17.8p (H1 2025: 14.6p)
· Cash generated from operations up 10.1% to
· Declared interim ordinary dividend of 7.5p per share (H1 2025: 6.2p)
Operational Highlights:
· Consistently strong operational performance continues to deliver high quality, sustainable growth
· Keystone continues to take advantage of positive recruitment market conditions:
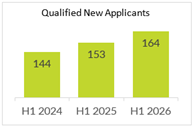
o 164 new applicants in the Period (H1 2025: 153)
o 30 high-calibre new Principals added in the Period bringing total Principals to 472 (
o Principals continue to drive growth of Pods with other fee earners increasing 19 in the Period to 140
· Driving forward an AI strategy focused on delivering real value and real-life solutions
· Initiated marketing brand refresh to reflect Keystone's enhanced position within the legal market
· Continued excellence of service delivery across all the Central office team
Current Trading and Outlook:
· The Group has made a positive start to H2 2026
· The Board are confident in the ongoing success of Keystone and expect revenue and adjusted PBIT for the year ending
(1) Management understands current market expectations for 2026 ahead of this announcement to be revenue
"I am delighted that the business continues to deliver such strong operational and financial performance, further reinforcing our ongoing investment in both people and our platform. As we maintain our reputation and leading position as the premier platform law firm, we remain confident that Keystone will continue to attract the high-quality talent needed to drive the business forward, delivering sustainable, long-term profits".
For further information please contact:
+44 (0) 20 3319 3700
+44 (0) 20 7886 2500
+44 (0) 20 7597 5970
keystonelaw@vigoconsulting.com
+44 (0)207 390 0233
The information contained within this announcement is deemed to constitute inside information as stipulated under the Market Abuse Regulation (EU) No. 596/2014 as it forms part of
Notes to editors
Keystone (AIM: KEYS) is a highly scalable, premier tech-enabled platform law firm. Ranked within the
· Lawyers have freedom, flexibility and autonomy, and are paid up to 75% of what they bill.
· Lawyers determine how, when and where they work, in contrast to the conventional law firm model.
· Lawyers are provided full infrastructure and support via its central office team, bespoke user-friendly IT platform, and network of colleagues and events.
Keystone is a full-service law firm, with 20 service areas and more than 50 industry sectors delivered by over 450 high calibre self-employed Principal lawyers who work from their own offices.
More information about Keystone can be found at www.keystonelaw.co.uk.
Chief Executive Officer's Statement
I am delighted to report another strong set of results for the first half of our financial year ("H1 2026" or the "Period"). These results reflect the continued strong performance of the business delivering revenue of
Conditions in the legal recruitment market have continued to be positive for Keystone, as demonstrated by the recruitment KPIs shown in the graphs below:
|
|
|
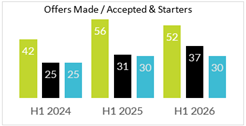
H1 2026 saw 30 new Principals join us, bringing the total number of Principals to 472 (
The central office team has continued to deliver the first-class infrastructure and support our lawyers need to excel. The efforts of our community and engagement team continue to be rewarded, whether that be through the successful onboarding and integration of new lawyers or through the positive feedback we receive from across the lawyer base regarding the thriving community and excellent events we run to bring our people together.
We have recently started a brand refresh project, working with external brand advisers to update our brand imagery so that it aligns more accurately with the law firm we are today and our position within the legal market. This project will continue to run through the second half of this year with implementation anticipated to span the end of this financial year.
For our IT team, the evolution of AI has created an exciting and rapidly evolving area of focus and opportunity. As reported in our last annual report and accounts, the development of this technology within the sector remains in its infancy, however, it is evolving extremely rapidly. Most legal IT tools now claim to include some elements of AI and there are also a substantial number of new entrants to the market, all promising an AI revolution. As in everything we do, our AI strategy is focused on delivering real value, providing real-life solutions to challenges experienced by our lawyers and / or central office team and bringing efficiencies and enhanced user experience across the business.
During the Period, we have rolled out a number of generative AI tools, which are available as extensions to the market leading products we already provide to our lawyers. These include the ability for our lawyers to produce file notes of Teams meetings in seconds and for our lawyers to use generative AI solutions across any documents held within NetDocuments (our secure cloud-based document management system). We have developed an internal tool using generative AI as well as an element of agentic AI. This enables our lawyers to interrogate our voluminous Operating Manual using basic English language queries providing them with logical answers as well as links to the relevant sections of the manual; taking only seconds. We have also worked with expert external consultants to identify areas where the deployment of bespoke agentic AI agents could deliver efficiency and enhance user experience across the business. We are now reviewing the output from this work in order to prioritise development and implementation which we anticipate will commence later this year. We continue to explore the market, testing other market leading products and considering what value these may bring to our lawyers.
I would like to take this opportunity to thank my colleagues across all teams of the central office for their dedication and passion, which continues to drive the business forwards and has made these results possible.
Dividend
I am pleased to announce that the Board has declared an interim ordinary dividend of 7.5p per share. This dividend will be payable on
Summary and outlook
We are delighted with the overall success of H1 2026 results. Keystone has produced another strong performance delivering high quality, sustainable growth, driving the business forwards and reasserting our position as market leader.
Although there remains global economic uncertainty, from which the
Chief Executive Officer
(1) Adjusted PBIT and adjusted PBT are calculated using profit before tax and adding back amortisation in the prior period and share-based payments for all periods.
(2) Management understands current market expectations for FY 2026 to be revenue of
CONSOLIDATED STATEMENT OF COMPREHENSIVE INCOME
For the period ended
|
|
Note |
6 months to (Unaudited) £ |
6 months to July 2024 (Unaudited) £ |
|
Revenue |
|
54,151,537 |
46,468,026 |
|
Cost of sales |
|
(40,358,020) |
(34,383,352) |
|
Gross profit |
|
13,793,517 |
12,084,674 |
|
Trade receivables impairment |
|
(265,266) |
(255,217) |
|
Corresponding reduction in trade payables |
|
180,059 |
177,885 |
|
|
|
(85,207) |
(77,332) |
|
Depreciation and amortisation |
|
(346,456) |
(447,286) |
|
Share-based payments |
2 |
(408,852) |
(378,934) |
|
Administrative expenses |
2 |
(7,211,696) |
(6,194,844) |
|
Other operating income |
|
43,461 |
28,710 |
|
Operating profit |
|
5,784,767 |
5,014,988 |
|
Finance income |
|
1,578,727 |
929,379 |
|
Finance costs |
|
(431,834) |
(400,167) |
|
Profit before tax |
|
6,931,660 |
5,544,200 |
|
Corporation tax expense |
|
(1,724,898) |
(1,492,880) |
|
Profit and total comprehensive income for the period attributable to equity holders of the Parent |
|
5,206,762 |
4,051,320 |
|
Basic EPS (p) |
1 |
16.5 |
12.9 |
|
Diluted EPS (p) |
1 |
16.2 |
12.6 |
The above results were derived from continuing operations.
CONSOLIDATED STATEMENT OF FINANCIAL POSITION
As at
|
|
Note |
(Unaudited) £ |
(Unaudited) £ |
(Audited) £ |
|
Assets |
|
|
|
|
|
Non-current assets |
|
|
|
|
|
Property, plant and equipment |
|
|
|
|
|
- Owned assets |
|
690,053 |
80,028 |
772,027 |
|
- Right-of-use assets |
|
1,741,680 |
2,206,259 |
1,973,730 |
|
Total property, plant and equipment |
|
2,431,733 |
2,286,287 |
2,745,757 |
|
Intangible assets |
|
4,807,411 |
4,880,512 |
4,807,411 |
|
Investments |
|
129,350 |
129,350 |
129,350 |
|
|
|
7,368,494 |
7,296,419 |
7,682,518 |
|
Current assets |
|
|
|
|
|
Trade and other receivables |
3 |
30,043,484 |
27,270,682 |
28,325,545 |
|
Corporation tax |
|
- |
29,899 |
- |
|
Cash and cash equivalents |
|
6,505,516 |
8,311,102 |
9,687,172 |
|
|
|
36,549,000 |
35,611,683 |
38,012,717 |
|
Total assets |
|
43,917,494 |
42,907,832 |
45,695,235 |
|
Equity and liabilities |
|
|
|
|
|
Equity |
|
|
|
|
|
Share capital |
|
63,434 |
63,186 |
63,186 |
|
Share premium |
|
9,920,760 |
9,920,760 |
9,920,760 |
|
Share-based payments reserve |
|
968,590 |
874,353 |
1,276,080 |
|
Retained earnings |
|
5,827,556 |
6,562,760 |
9,102,454 |
|
Equity attributable to equity holders of the Parent |
|
16,780,340 |
17,421,058 |
20,362,480 |
|
Non-current liabilities |
|
|
|
|
|
Lease liabilities |
|
1,320,595 |
1,762,833 |
1,563,376 |
|
Deferred tax liabilities |
|
- |
14,610 |
- |
|
Provisions |
|
1,198,130 |
912,071 |
1,162,235 |
|
|
|
2,518,725 |
2,689,514 |
2,725,611 |
|
Current liabilities |
|
|
|
|
|
Trade and other payables |
|
23,942,119 |
22,202,412 |
21,985,238 |
|
Lease liabilities |
|
594,848 |
594,848 |
594,848 |
|
Corporation tax liability |
|
81,462 |
- |
27,058 |
|
|
|
24,618,429 |
22,797,260 |
22,607,144 |
|
Total liabilities |
|
27,137,154 |
25,486,773 |
25,332,755 |
|
Total equity and liabilities |
|
43,917,494 |
42,907,832 |
45,695,235 |
The interim statements were approved and authorised for issue by the Board of Directors on
Director
consolidated statement OF CHANGES IN EQUITY
For the period ended
|
|
Attributable to equity holders of the Parent |
||||
|
Share capital £ |
Share premium £ |
Share-based payment reserve £ |
Retained earnings £ |
Total £ |
|
|
At |
62,963 |
9,920,760 |
1,059,531 |
5,896,437 |
16,939,691 |
|
Profit for the period and total comprehensive income |
- |
- |
- |
4,051,320 |
4,051,320 |
|
Transactions with owners |
|
|
|
|
|
|
Share-based payments vesting |
223 |
- |
(564,113) |
564,113 |
223 |
|
Share-based payments awards |
- |
- |
378,964 |
- |
348,964 |
|
Dividends paid |
- |
- |
- |
(3,949,109) |
(3,949,109) |
|
At |
63,186 |
9,920,760 |
874,353 |
6,562,760 |
17,421,058 |
|
Profit for the period and total comprehensive income |
- |
- |
- |
4,498,453 |
4,498,453 |
|
Transactions with owners |
|
|
|
|
|
|
Share-based payments vesting |
- |
- |
- |
- |
- |
|
Share-based payments awards |
- |
- |
401,698 |
- |
401,698 |
|
Dividends paid |
- |
- |
- |
(1,958,760) |
(1,958,760) |
|
At |
63,186 |
9,920,760 |
1,276,080 |
9,102,454 |
20,362,480 |
|
Profit for the period and total comprehensive income |
- |
- |
- |
5,206,762 |
5,206,762 |
|
Transactions with owners |
|
|
|
|
|
|
Share-based payments vesting |
248 |
- |
(716,342) |
716,343 |
248 |
|
Share-based payments awards |
- |
- |
408,852 |
- |
408,852 |
|
Dividends paid |
- |
- |
- |
(9,198,002) |
(9,198,002) |
|
At |
63,434 |
9,920,760 |
968,590 |
5,827,556 |
16,780,340 |
CONSOLIDATED STATEMENT OF CASH FLOWS
For the period ended
|
|
Note |
6 months to (Unaudited) £ |
6 months to July 2024 (Unaudited) £ |
Year ended (Audited) £ |
|
Cash flows from operating activities |
|
|
|
|
|
Profit before tax |
|
6,931,660 |
5,544,200 |
11,684,999 |
|
Adjustments to cash flows from non-cash items |
|
|
|
|
|
Depreciation and amortisation |
2 |
346,056 |
447,286 |
823,681 |
|
Share-based payments |
|
408,852 |
378,934 |
780,662 |
|
Finance income |
|
(1,578,727) |
(929,379) |
(1,966,246) |
|
Finance costs |
|
431,834 |
400,167 |
855,043 |
|
|
|
6,539,675 |
5,841,208 |
12,178,139 |
|
Working capital adjustments |
|
|
|
|
|
(Increase) in trade and other receivables |
(1,717,939) |
(2,076,333) |
(3,131,196) |
|
|
Increase in trade and other payables |
1,956,881 |
2,419,825 |
2,202,651 |
|
|
Increase in provisions |
|
35,895 |
4,126 |
254,290 |
|
Cash generated from operations |
|
6,814,512 |
6,188,826 |
11,503,884 |
|
Interest paid on client balances |
|
(377,191) |
(370,980) |
(767,002) |
|
Interest portion of lease liability |
|
(54,643) |
(29,187) |
(88,041) |
|
Corporation taxes paid |
|
(1,670,492) |
(2,800,524) |
(4,404,523) |
|
Cash generated from operating activities |
4,712,186 |
2,988,135 |
6,244,318 |
|
|
Cash flows from/(used in) investing activities |
|
|
|
|
|
Interest received |
|
1,578,727 |
929,379 |
1,966,246 |
|
Purchases of property, plant and equipment |
(32,432) |
(9,609) |
(772,373) |
|
|
Net cash generated from/(used in) investing activities |
1,546,295 |
919,770 |
1,193,873 |
|
|
Cash flows from financing activities |
|
|
|
|
|
Proceeds from issue of ordinary shares |
|
248 |
223 |
223 |
|
Lease repayments |
|
(251,383) |
(14,989) |
(210,445) |
|
Dividends paid |
|
(9,189,002) |
(3,949,109) |
(5,907,869) |
|
Net cash (used in) financing activities |
(9,440,137) |
(3,963,875) |
(6,118,091) |
|
|
Net (decrease)/increase in cash and cash equivalents |
|
(3,181,656) |
(55,970) |
1,320,100 |
|
Cash at 1 February |
|
9,687,172 |
8,367,072 |
8,367,072 |
|
Cash at 31 July |
|
6,505,516 |
8,311,102 |
9,687,172 |
NOTES TO THE interim report
1. General Information
The Company was incorporated as
The Interim Report is presented in Pounds Sterling, being the functional currency of the companies within the Group.
ACCOUNTING POLICIES
STATEMENT OF COMPLIANCE
The Interim Report has been prepared in accordance with the recognition and measurement principles of
BASIS OF PREPARATION
The Interim Report does not constitute statutory accounts as defined in Section 434 of the Companies Act 2006. The Group's statutory financial statements for the year ended
The Interim Report has not been audited or reviewed, in accordance with the International Standard on Review Engagement 2410 (
GOING CONCERN
The Interim Report has been prepared on a going concern basis as the Directors have reasonable expectation that the Group has adequate resources to continue in operational existence for the foreseeable future. The Group has no debt, is strongly cash generative and has a strong trading performance. The Group's forecasts and projections show that the Group has sufficient resources for both current and anticipated cash requirements.
ACCOUNTING DEVELOPMENTS
There have been no new standards or interpretations relevant to the Group's operations applied in the Interim Report for the first time.
ADJUSTED PBT
Adjusted PBT is utilised as a key performance indication for the Group and is calculated as follows:
|
|
6 months to (Unaudited) £'000 |
6 months to July 2024 (Unaudited) £'000 |
|
Profit before tax |
6,932 |
5,544 |
|
Amortisation |
- |
175 |
|
Share-based payments |
409 |
379 |
|
Adjusted PBT |
7,341 |
6,098 |
Earnings per Share
Basic earnings per share is calculated by dividing the profit for the period by the weighted average number of ordinary shares outstanding during the period. The weighted average number of shares in the period was 31,625,863 (H1 2025: 31,515,028) and the basic earnings per share was 16.5p (H1 2025: 12.9p). Diluted earnings per share is calculated by dividing the same profit by the weighted average number of ordinary shares, taking into account the dilution effect from grants made under the Long Term Incentive Plan (32,210,899; H1 2025: 32,041,554). Diluted earnings per share was 16.2p (H1 2025: 12.6p).
The adjusted earnings per share was 17.8p (H1 2025: 14.6p), whilst the diluted adjusted earnings per share was 17.4p (H1 2025: 14.4p). Adjusted earnings are stated by making the same adjustments to earnings as those made in calculating adjusted PBT.
2. Expenses by Nature
|
Expenses are comprised of: |
6 months to (Unaudited) £ |
6 months to July 2024 (Unaudited) £ |
|
Depreciation - right-of-use assets |
232,050 |
221,746 |
|
Depreciation - other |
114,406 |
50,098 |
|
Amortisation |
- |
175,442 |
|
Staff costs |
3,907,870 |
3,291,181 |
|
Share-based payments |
408,852 |
378,934 |
|
Other administrative expenses |
4,104,844 |
3,531,933 |
|
|
8,768,022 |
7,649,334 |
Included within staff costs above are the costs of employed fee earners who are included within cost of sale (H1 2026:
3. Trade and Other Receivables
|
|
(Unaudited) £ |
(Unaudited) £ |
(Audited) £ |
|
Trade receivables |
19,060,337 |
17,250,578 |
17,283,997 |
|
Provision for impairment of trade receivables |
(5,497,587) |
(4,649,750) |
(5,497,587) |
|
Net trade receivables |
13,562,750 |
12,600,828 |
11,786,410 |
|
Accrued income |
13,533,029 |
11,760,727 |
12,856,306 |
|
Prepayments |
1,305,226 |
1,504,815 |
1,919,904 |
|
Unbilled disbursements |
1,022,206 |
1,021,297 |
842,334 |
|
Reimbursement asset |
478,311 |
280,000 |
442,541 |
|
Other receivables |
141,963 |
103,015 |
478,050 |
|
Total current trade and other receivables |
30,043,484 |
27,270,682 |
28,325,545 |
|
Net trade receivables average age (days) (unaudited) |
33 |
33 |
34 |
4. DIVIDENDS
The Directors have declared an interim ordinary dividend of 7.5p per share (H1 2025: ordinary dividend of 6.2p per share). The dividend will be paid on
48 Chancery
RNS may use your IP address to confirm compliance with the terms and conditions, to analyse how you engage with the information contained in this communication, and to share such analysis on an anonymised basis with others as part of our commercial services. For further information about how RNS and the