
22 September 2025
("NFM" or the "Company")
Final Results and Publication of Annual Report
CHAIRMAN'S LETTER
Dear Shareholders,
The change in name to
Our traditional copper business is now primarily focused on the NWQ Copper Project in the world-class Mt Isa region in
NFM's pivot to critical minerals via the Harts Range Project, particularly heavy rare elements (HRE) dysprosium and terbium, comes at a time of significant geopolitical change. Notably, from a national security perspective, the moves by the US government to diversify supply chains of critical minerals away from
Over the course of the financial year, through conducting surface sampling and geophysical campaigns, NFM's geology team has been able to delineate high-conviction targets for drill-testing. The inaugural drilling campaign, which is awaiting regulatory approval, should provide invaluable insight into the potential to define a HRE-Mineral Resource Estimate at the Harts Range Project. Concurrently, we are reviewing processing options for HRE-enriched material to map out a potential commercialisation pathway to facilitate future offtake discussions with global magnet supply chain groups.
Having signed a Memorandum of Understanding with Austral Resources Australia Ltd (Austral; ASX: AR1), we now have the capability to create value from leveraging the two groups Mt Isa copper belt assets. On a bundled basis, the combined footprint and Austral's Mt Kelly copper processing plant, delivers a compelling integrated scalable asset base that delivers significant exploration and mining potential. Our initial objective is to provide copper ore from the Big One Deposit (MRE: 2.1Mt @ 1.1% Cu) then diversify to other potential satellite prospects within the NWQ Copper Project.
On behalf of the Board, we would like to thank shareholders for supporting our recent capital raising exercise, as that provides the necessary working capital to advance our two exciting exploration projects and generate value for shareholders.
Chairman
19th September 2025
ANNUAL REPORT AND ACCOUNTS
The Company's Annual Report and Accounts is available on the Company's website at: https://newfrontierminerals.com/investor-dashboard/
For further information please contact:
|
|
+61 8 6558 0886 |
|
|
|
|
|
|
|
S. P. Angel Corporate Finance LLP
(Corporate Broker) |
+44 (0)1483 413500 |
|
Nick Emerson |
+44 (0) 20 7409 3494 |
|
|
|
|
St Brides Partners Ltd (Financial PR) |
+44 (0)20 7236 1177 |
|
|
|
About
Other interests include the NWQ Copper Project, situated in the copper-belt district circa 150km north of Mt Isa in
Results
The loss after tax for the year ended 30 June 2025 was $2,458,209 (30 June 2024 loss of $1,461,849) and the net assets of the Group at 30 June 2025 were $11,151,931 (2024: $10,610,574).
Dividends
No dividend was paid or declared by the Group during the year and up to the date of this report.
Corporate Structure
Nature of Operations and Principal Activities
During the financial year, the principal activity of the Group was mineral exploration and examination of new resource opportunities. The Group currently holds copper and rare earth minerals projects in
Employees
The Group had no employees at 30 June 2025 (2024: Nil).
Operating and Financial Risk
The Group's activities have inherent risk and the Board is unable to provide certainty of the expected results of activities, or that any or all of the likely activities will be achieved. The material business risks faced by the Group that could influence the Group's future prospects, and how the Group manages these risks, are detailed below:
Operational Risks
The Group may be affected by various operational factors. In the event that any of these potential risks eventuate, the Group's operational and financial performance may be adversely affected. No assurances can be given that the Group will achieve commercial viability through the successful exploration, sale, and/or development of its tenement interests. Until the Group is able to realise value from its projects, it is likely to incur ongoing operating losses.
The operations of the Group may be affected by various factors, including failure to locate or identify mineral deposits, failure to achieve predicted grades in exploration, operational and technical difficulties encountered in exploration, insufficient or unreliable infrastructure such as transport, unanticipated metallurgical problems which may affect extraction costs, adverse weather conditions, industrial and environmental accidents, and unexpected shortages or increases in the costs of contractor services.
The Group's MREs are made in accordance with the 2012 edition of the JORC Code. MREs are estimates only. An estimate is an expression of judgement based on knowledge, experience and industry practice. Estimates which were valid when originally calculated may alter significantly when new information or techniques become available. In addition, by their very nature, resource estimates are imprecise and depend to some extent on interpretations, which may prove to be inaccurate.
The tenements are at various stages of exploration, and potential investors should understand that mineral exploration and development are speculative and high-risk undertakings that may be impeded by circumstances and factors beyond the control of the Group.
There can be no assurance that exploration of the Tenements, or any other exploration properties that may be acquired in the future, will result in the discovery of an economic mineral resource. Even if an apparently viable deposit is identified, there is no guarantee that it can be economically exploited.
There is no assurance that exploration or project studies by the Group will result in the definition of an economically viable mineral deposit or that the exploration tonnage estimates, and conceptual project developments are able to be achieved. In the event the Group successfully delineates economic deposits on any Tenement, it may apply for a mining lease to undertake development and mining on the relevant Tenement. There is no guarantee that the Group will be granted a mining lease if one is applied for and if a mining lease is granted, it will also be subject to conditions which must be met.
Further Capital Requirements
The Group's projects may require additional funding to progress activities. There can be no assurance that additional capital or other types of financing will be available if needed to further exploration or possible development activities and operations or that, if available, the terms of such financing will be favourable to the Group.
Native Title and Aboriginal Heritage
There are areas of the Group's projects over which legitimate common law and/or statutory Native Title rights of Aboriginal Australians exist. Where Native Title rights do exist, the Group must obtain consent of the relevant landowner to progress the exploration, development and mining phases of operations. Where there is an Aboriginal Site for the purposes of the Aboriginal Heritage legislation, the Group must obtain consent in accordance with the legislation.
The Group's Activities are Subject to Government Regulations and Approvals
The Group is subject to certain Government regulations and approvals. Any material adverse change in government policies or legislation in
Global Conditions
Global economic conditions (including movements inflation rates and currency exchange rates), national and international political circumstances, natural disasters, and other global events, may have an adverse effect on the Company's exploration activities, as well as on its ability to fund those activities.
General economic conditions may also affect the value of the Company and its market valuation regardless of its actual performance.
Review of Operations
The copper business has undergone a restructure, with the primary focus now advancing the NWQ Copper Project in
A closer review of the core projects and key undertakings over the financial year follow:
Harts Range Project Acquisition
NFM finalised a binding agreement with Audax Holdings Pty Ltd to acquire an 85% effective interest in the Harts Range Niobium, Uranium, and Heavy Rare Earths Project through a two-stage earn-in arrangement in 2QFY25. Located 140 km north-east of Alice Springs, the project initially spanned two granted tenements covering 110 km (Figure 1).
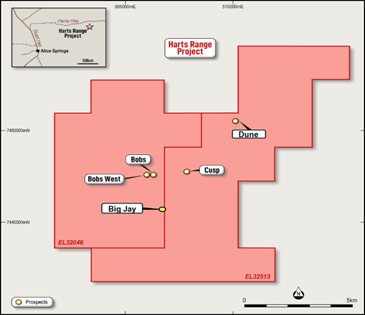
Figure 1: Primary targets at Harts Range Project
Historical assays from 29 rock chip samples collected across five prospects - Cusp, Bobs, Bobs West, Thorium Anomaly, and Niobium Anomaly - reported grades of up to 23.2% niobium (Nb), 12.7% uranium (U), and 12.7% Total Rare Earth Elements (TREE) which are shown in Figure 2.
|
Figure 2: Historical Rock Chip Results - Cusp Prospect (PCT) |
||||||||||||||
|
Sample ID |
HR419 |
HR420 |
HR421 |
HR480 |
HR481 |
HR482 |
HR483 |
HR484 |
HR485 |
HR486 |
HR487 |
HR488 |
HR490 |
|
|
Niobium (%) |
17.5 |
1.1 |
22.7 |
21.0 |
16.3 |
23.2 |
23.0 |
1.0 |
24.0 |
20.6 |
20.0 |
19.4 |
18.0 |
|
|
Uranium (%) |
10.1 |
2.0 |
11.0 |
11.4 |
10.4 |
12.1 |
12.2 |
0.0 |
11.6 |
11.2 |
11.2 |
11.3 |
11.3 |
|
|
Yttrium (%) |
5.6 |
16.0 |
6.9 |
8.0 |
3.3 |
8.6 |
8.1 |
0.0 |
7.9 |
7.4 |
8.3 |
7.8 |
7.3 |
|
|
Tantalum (%) |
9.3 |
0.9 |
5.5 |
7.0 |
11.0 |
5.9 |
6.6 |
0.1 |
5.9 |
4.1 |
5.2 |
4.7 |
6.3 |
|
|
Dysprosium (%) |
1.1 |
0.0 |
1.6 |
1.7 |
0.7 |
1.9 |
1.7 |
0.0 |
1.8 |
1.6 |
1.8 |
1.7 |
1.5 |
|
|
Terbium (%) |
0.18 |
0.05 |
0.24 |
0.27 |
0.10 |
0.29 |
0.27 |
<0.01 |
0.27 |
0.25 |
0.27 |
0.26 |
0.24 |
|
Note: Niobium is typically coincident with Heavy Rare Earths mineralisation, Tantalum and Uranium (Reference 1)
These include 2.85% dysprosium (Dy), 0.32% terbium (Tb), and 14.9% tantalum (Ta), confirming the area's high potential to host critical minerals. As part of due diligence, a preliminary field visit in October 2024 validated these historical results, identifying extensive pegmatite occurrences and confirming that mineralisation potential had been underexplored.
Growing the Harts Range Portfolio
Following the successful acquisition, NFM expanded its exploration footprint with an additional tenure application east of the primary project area. The Harts Range East Project increased the total tenure to 135km. Early assessments have highlighted its alignment with the mineralisation trends of the main tenements.
Early Exploration Activities
The geology team made positive strides during their second reconnaissance visit to the Harts Range Project in November 2024. The visit aimed to evaluate historical prospects and explore new areas with potential for viable targets. Key activities included assessing known prospects such as Cusp, Bobs, Bobs West, and Dune, collecting rock chip samples, conducting field readings, and documenting critical observations for further analysis.
A notable development was the identification of a 500m long pegmatite at the newly named Big Jay Prospect, located 1.6km south-southeast of the Bobs Prospect.
Detailed rock chip sampling at the Cusp and Bobs Prospects reported high-grade results exceeding historical assays, with highlights including 29.80% Nb2O5, 14.04% U3O8, 1.63% Dy2O3, 0.22% Tb4O7, and 23.02% Ta2O5. These findings reinforced the project's significant exploration potential, particularly along an interpreted 12km mineralised corridor.
Helicopter-Borne Geophysical Survey
NFM completed a comprehensive helicopter-borne radiometric and magnetic survey across the Harts Range Project. The survey was a pivotal step in accelerating the exploration of the tenements, with the primary aim of identifying extensions of known uranium, niobium, and HRE mineralisation. Pleasingly, the survey provided critical data to enhance the prioritisation of future drilling and ground truthing activities.
The analysis highlighted numerous distinct radiometric anomalies and confirmed the structural alignment of mineralised pegmatites at key locations, including the Cusp and Bobs Prospects. Enhanced magnetic imagery revealed that these prospects align along an ENE-trending structure, suggesting potential mineralised extensions in both the northern and southern regions of the project. The survey data underscored the significant exploration potential of the Harts Range Project, setting the stage for more detailed investigations.
In March 2025, NFM completed a detailed geophysical interpretation by Southern Geoscience Consultants. This study built upon the initial survey by identifying 46 priority exploration targets across the project area. Specifically, the evaluation pinpointed 18 high-priority, 16 medium-priority, and 12 lower-priority targets for follow-up exploration. A 1:10,000 scale structural interpretation was achieved, marking a localised radiometric and magnetic anomaly at both the Cusp and Bobs Prospects. The data has greatly assisted in target drillhole generation.
Rare Earth Distribution Analysis
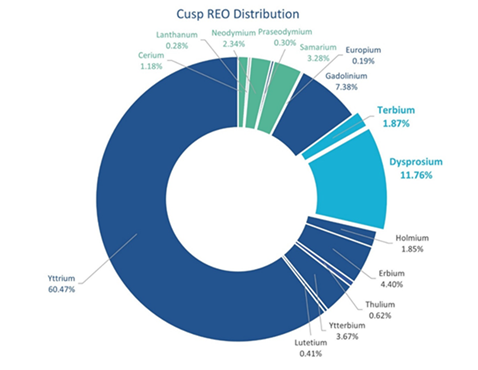
Rare earth distribution analysis formed a crucial component of ongoing exploration activities at the Harts Range Project. The analysis focused on rock chip samples collected from pegmatite outcrops in the Cusp and Bobs Prospects. Results revealed exceptionally high concentrations of heavy rare earth elements (HREEs), with Dysprosium Oxide (Dy2O3) and Terbium Oxide (Tb4O7) identified as dominant contributors to the total rare earth oxide (TREO) composition.
At the Cusp Prospect, analysis of 13 mineralised rock chip samples revealed that over 92% of the rare earth oxide basket was composed of heavy rare earths. Dysprosium and Terbium combined accounted for 13.63% of the TREO basket, with Dysprosium Oxide (11.76%) and Terbium Oxide (1.87%) demonstrating the significant value of this deposit.
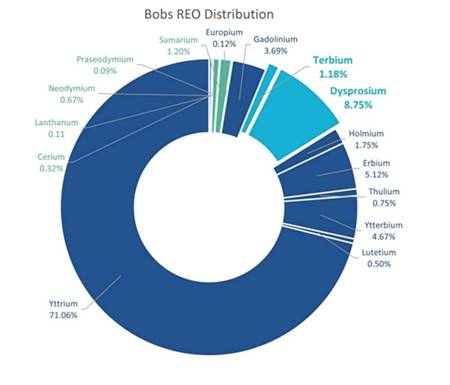
The Bobs Prospect showed even higher HREE concentrations in its 12 analysed samples, with HREs making up more than 97% of the rare earth basket. Yttrium Oxide (71.06%) was particularly prominent, alongside Dysprosium Oxide (8.75%) and Terbium Oxide (1.18%). The similarities between the Cusp and Bobs Prospects, both structurally and mineralogically, highlighted the potential for further high-value discoveries along their east-west trending structure.
Strategic Importance of Heavy Rare Earth Elements - Summary
Heavy rare earth elements like Dysprosium and Terbium are crucial for enhancing Neodymium-Iron-Boron magnets, essential in technologies driving electrification and green energy, including electric vehicles and wind turbines. Dysprosium improves thermal stability, while Terbium enhances durability and resistance to demagnetisation.
Demand for Dysprosium is rising steadily, with projected growth from US$1,054m in 2025 to US$1,750m by 2035, driven by its importance in sectors such as automotive, renewable energy, and electronics.
Global supply challenges stem from
The Harts Range Project positions NFM as a key player in addressing these challenges. With significant deposits of heavy rare earths like Dysprosium and Terbium discovered at the Cusp and Bobs Prospects, the project offers the potential to contribute to high-demand markets and reduce reliance on Chinese sources, especially in the defence and green energy sectors.
Distribution Analysis
NFM conducted rare earth distribution analysis on 25 rock chip samples from the Cusp and Bobs Prospects, revealing significant HRE mineralisation, particularly Dysprosium and Terbium, critical for defence applications (Figure 3 & 4).
Key findings include:
Cusp Prospect (13 samples):
· High HRE concentration, with over 92% of the Rare Earth Oxide (REO) basket comprising HRE
· Dysprosium Oxide (Dy2O3): 11.75%, Terbium Oxide (Tb4O7): 1.87%
· Rare earth basket comprises over 92% HRE minerals with combined Dysprosium and Terbium distribution making up 13.63% of TREO
|
|
|
|
Figure 3: Distribution of Dysprosium and Terbium rich mineralisation at Cusp Prospect |
|
Bobs Prospect (12 samples):
· Higher HRE concentration, with over 97% of the TREO basket comprising HREs
· Yttrium Oxide (Y2O3): 71.06%, Dysprosium Oxide (Dy2O3): 8.75%, Terbium Oxide (Tb4O7): 1.18%
· Combined Dysprosium and Terbium: 9.93% of TREO basket
|
Figure 4: Distribution of Dysprosium and Terbium rich mineralisation at Bobs Prospect
|
Both prospects, located 1.6km apart along the same east-west trending structure, show similar mineralisation and geological settings, indicating substantial exploration potential.
Field Exploration Site Visits
A field exploration campaign in April 2025 at the Harts Range Project, was aimed at investigating 46 targets identified through the prior airborne geophysical survey, targeting untested areas for potential Uranium, Niobium, and HREE mineralisation, with Uranium serving as a key pathfinder element.
Exploration efforts led to the discovery of two new prospects, "Paddington" and "Westminster," located approximately 200m and 450m west of the Bobs Prospect, respectively.
Assay results from 14 rock chip samples (HRS019-HRS032) collected from plagioclase and mica-rich pegmatite outcrops confirmed high-grade HREE mineralisation (Figure 5).
Notable results included:
HRS019 (Paddington) with 10.61% TREO (1.28% Dy2O3, 0.22% Tb4O7), 23.56% Nb2O5, and 15.67% Ta2O5;
HRS031 (Paddington) with 5.17% TREO (0.61% Dy2O3, 0.10% Tb4O7), 11.49% Nb2O5, and 7.30% Ta2O5; and
HRS032 (Westminster) with 7.46% TREO (0.53% Dy2O3, 0.05% Tb4O7), 0.01% Nb2O5, and 0.002% Ta2O5.
|
Figure 5: Prospects Summary Table
|
||||||
|
PROSPECT |
Best TREO (%) |
Max HREO/TREO (%) |
Max Dy2O3 (%) |
Max Tb4O7 (%) |
Max Nb2O5 (%) |
Max Ta2O5 (%) |
|
CUSP |
17.8% (HR482) |
89.6% (HRS012) |
2.2% (HR482) |
0.2% (HR482) |
33.2% (HR482) |
13.4% (HR481) |
|
BOBS |
20.1% (HR508) |
94.5% (HR506) |
1.7% (HR505) |
0.2% (HR505) |
10.1% (HRS002) |
23% (HRS002) |
|
PADDINGTON |
10.6% (HRS019) |
84.68% (HRS031) |
1.3% (HRS019) |
0.2% (HRS019) |
23.6% (HRS019) |
15.7% (HRS019) |
|
WESTMINSTER |
7.5% (HRS032) |
96.69% (HRS032) |
0.5% (HRS032) |
0.06% (HRS032) |
0.01% (HRS032 |
0.03% (HRS032) |
These samples, submitted to Intertek Perth Laboratory, revealed high HREO/TREO ratios up to 96.69%, highlighting significant Dysprosium and Terbium enrichment alongside notable Niobium and Tantalum values, particularly in samarskite mineralisation.
The Paddington, Westminster, Bobs, and Cusp prospects collectively defined an east-west trending structural corridor extending over 2km, identified through geophysical interpretation as a potential control for the mineralisation.
In June 2025, NFM's geological team returned to the Harts Range Project, with the aim to finalise high-priority drill targets at the Cusp, Bobs, Paddington, Westminster and newly identified Old Trafford and Bank Prospects.
The Old Trafford Prospect, located 320m west of Westminster, featured a plagioclase and quartz-rich pegmatite outcrop with samarskite fragments, recording Geiger counter readings up to 6 μSv (sample HRS066). At Westminster, further inspection confirmed samarskite in a micaceous pegmatite section with readings up to 8 μSv (sample HRS064). North of Cusp, the Bank Prospect revealed copper mineralisation (0.5-3% Cu) in foliated gneiss (sample HRS055).
A prominent magnetic anomaly, approximately 150-200m in diameter, was identified at the Kings Cross Prospect in the southern tenement area, interpreted as a series of smaller features and one larger anomaly.
Expanded Footprint
NFM has taken a proactive step in expanding its operational footprint by applying for three new tenements (EL34109 & EL34110 & EL34147) at Harts Range. This expansion reflects NFM's commitment to exploring and developing high-potential mineral resources in the region.
NWQ COPPER PROJECT,
Strategic Alliance Formalised
A significant development to advancing the NWQ Copper Project was formalising the Memorandum of Understanding (MOU) with Austral Resources Australia Ltd (ASX: AR1) on 21 January 2025 to establish a strategic alliance targeting the Mt Isa copper belt. This collaboration aims to integrate the two groups complementary assets, leveraging Austral's Mt Kelly copper processing plant and NFM's exploration and mining expertise to unlock significant value for shareholders.
The combined footprint within the Mt Isa copper belt positions the alliance as a competitive force amidst industry majors such as BHP, Anglo American, and Glencore. NFM's objective is to supply copper ore from the Big One Deposit (Mineral Resource Estimate of 2.1 Mt at 1.1% Cu) then expand activity to other satellite prospects within the NWQ Copper Project.
Under the agreement, Austral would process NFM's copper ore at its Mt Kelly facility, contingent on metallurgical test-work requirements being satisfied. This partnership is mutually beneficial as it provides NFM a clear pathway to production, while enabling Austral to secure a new source of copper ore to bolster throughput at the processing plant.
The MOU outlined a collaborative framework where both companies committed to working on a best-endeavours basis to capitalise on their shared resources. Key undertakings under this alliance include the following objectives:
· Formalising a processing agreement for NFM to supply copper ore from the Big One Deposit and, if suitable, other prospective targets within the NWQ Copper Project;
· Conducting metallurgical test-work at Austral's Mt Kelly plant to ensure the ore meets processing standards;
· Ensuring profit-sharing terms are equitable, guaranteeing that neither party incurs losses as part of the arrangement; and,
· The agreement sets out roles for both groups to achieve these objectives.
· NFM would focus on progressing regulatory, technical, and operational milestones, including:
· Applying for a mining lease over the Big One Deposit, with the process anticipated to take 18-24 months;
· Seeking approval for trial mining and metallurgical testing of the existing copper oxide stockpiles at the Big One Deposit;
· Expanding the known resource through further drilling campaigns; and
· Commencing exploration of satellite prospects within the NWQ Copper Project.
Austral's responsibilities include performing the necessary metallurgical testing to confirm ore suitability and supporting NFM through its mining lease application process.
The Board believes this strategic alliance underscores NFM's steady progress in advancing the NWQ Copper Project and marks a pivotal moment in its exploration efforts to position the group as a key player within the Mt Isa copper belt. Both groups expressed a shared commitment to achieving mutually beneficial outcomes through this relationship.
Surface Sampling Campaign - Big One Deposit
NFM's geology team completed a thorough surface sampling campaign at the Big One Deposit which targeted regions near the line of lode, historical workings, and the known orebody. Results from the campaign returned rock chip assays of up to 12% Cu, confirming the presence of a significant copper anomaly. These results suggest that copper mineralisation likely extends west along strike from the historical workings and known orebody. Additionally, geochemical data indicated the potential for mineralisation to extend south and east of the existing line of lode. The assay results validated previously identified induced polarisation conductivity anomalies located north of the line of lode (Figure 6), further supporting the potential for resource growth.
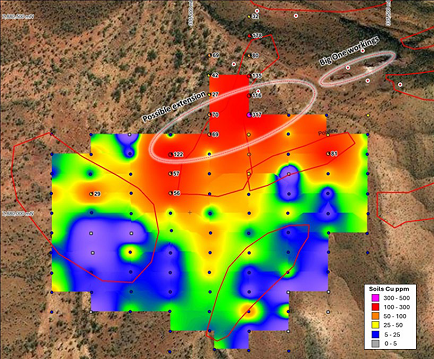
Figure 6: Enlarged copper target area at big one deposit
The geology team utilised the three-day campaign to conduct detailed geological mapping, providing critical insights into copper-bearing faulting trends at the deposit. This comprehensive understanding has laid a strong foundation for advancing exploration activities in the area. As such, geology will integrate the new surface sampling data with historical information to refine drill target selection. These new targets aim to extend known copper mineralisation, leveraging the robust results achieved through the surface sampling campaign to unlock further resource potential at the Big One Deposit.
UNLOCKING VALUE FROM NON-CORE ASSETS
The Board's strategy of unlocking value through divesting non-core copper assets has been successful as over the past 18-months all three Australian assets have now been sold, including:
· Broken Hill West Project, comprising two tenements, was acquired by Rimfire Pacific Mining Ltd (ASX: RIM) for 13.4m RIM shares which have since been sold.
· Cangai Copper Mine, comprising three granted tenements, was acquired by Infinity Mining Ltd (ASX: IMI) for 40m shares and 20m options (five-year term and an exercise price of $0.07) which have not been sold.
· Broken Hill East Project, comprising two tenements, was acquired by Impact Minerals Ltd (ASX: IPT) based on $275,000 worth of new IPT shares on the 14-day VWAP of $0.0073 which have since been sold.
Corporate Activity
Name Change to
The Company (formerly named
For the London Stock Exchange ("LSE"), the Company confirmed the effective date of its name change, along with updates to its LSE ticker and ISIN, on 20 December 2024. Accordingly, the Company began trading under its new name, ticker (LSE: NFM), and ISIN (AU0000368748) from the pre-market session on that date.
Additionally, the Company announced the launch of its new website, which is now accessible at https://newfrontierminerals.com/.
The rebranding reflects
Investor and Shareholder Engagement
Over the course of the financial year, the Board and management presented the
Placement
New Frontier raised A$1.59m through a placement of 144,477,270 shares at A$0.011 each, supported by institutional and sophisticated investors.
Significant Changes in the State of Affairs
There were no significant changes in the state of affairs of the Group during the year, other than as outlined elsewhere in this report.
Significant Events after the Balance Date
In September, the Board resolved to exit the Mkushi Project in
Other than as stated above, there were no known material significant events from the end of the financial year to the date of this report that have significantly affected, or may significantly affect the operations of the Group, the results of those operations, or the state of affairs of the Group in future financial periods.
Likely Developments and Expected Results of Operations
The Group remains focused on progressing its two (2) pillared strategy which includes continued exploration efforts at NWQ Copper Project in
Environmental Regulation and Performance
The operations of the Group are presently subject to environmental regulation under the laws of the
Share Options
As at the date of this report, there were 23,500,000 unissued ordinary shares under unlisted options. The details of the unlisted options at the date of this report are as follows
|
Number |
Exercise Price |
Expiry Date |
|
20,000,000 |
$0.0165 |
10 June 2028 |
|
3,500,000 |
£0.0068 |
7 August 2030 |
During the year ended 30 June 2025, 8,000,000 unlisted options expired.
Performance Shares
At 30 June 2025, none of the conditions of the performance shares disclosed in the 2024 year annual report were met. As a result, all performance shares have now expired.
Indemnification and Insurance of Directors and Officers
The Group has made an agreement indemnifying all the Directors and Officers of the Group against all losses or liabilities incurred by each Director or Officer in their capacity as Directors or Officers of the Group to the extent permitted by the Corporation Act 2001. The indemnification specifically excludes wilful acts of negligence. The Group paid insurance premiums in respect of Directors' and Officers' Liability Insurance contracts for current officers of the Group. The liabilities insured are damages and legal costs that may be incurred in defending civil or criminal proceedings that may be brought against the Officers in their capacity as Officers of entities in the Group. The total amount of insurance premiums paid has not been disclosed due to confidentiality reasons.
Proceedings on Behalf of the Group
No person has applied for leave of the court to bring proceedings on behalf of the Group or intervene in any proceedings to which the Group is a party for the purpose of taking responsibility on behalf of the Group for all or any part of those proceedings. The Group was not a party to any such proceedings during the year.
Indemnity and Insurance of Auditor
The Company has not, during or since the end of the financial year, indemnified or agreed to indemnify the auditor of the company or any related entity against a liability incurred by the auditor.
Corporate Governance
In recognising the need for the highest standards of corporate behaviour and accountability, the Directors of
Auditor's Independence Declaration
Section 307C of the Corporations Act 2001 requires our auditors, HLB Mann Judd, to provide the directors of the Company with an Independence Declaration in relation to the audit of the financial report. This Independence Declaration is set out on page 27 of the annual report and forms part of this directors' report for the year ended 30 June 2025.
There were no non-audit services provided by the Group's auditor during the year ended 30 June 2025.
This report is signed in accordance with a resolution of the Board of Directors.
Non-Executive Chairman
19th September 2025
COMPETENT PERSON STATEMENT
The information in this report that relates to Exploration Results, Exploration Targets and Mineral Resources for the Harts Range Project contained in this announcement is based on a fair and accurate representation of the publicly available information at the time of compiling this report and is based on information and supporting documentation compiled by
ASX Listing Rule 5.23.2
Consolidated Statement of Profit or Loss and Other Comprehensive Income
for the year ended 30 June 2025
|
|
Note |
30 June 2025 $ |
|
30 June 2024 $ |
|
Continuing Operations |
|
|
|
|
|
|
|
|
|
|
|
Interest income
|
|
22,969 |
|
35,661 |
|
Other Income |
3 |
144,204 |
|
- |
|
Revenue |
|
167,173 |
|
35,661 |
|
Listing and public company expenses |
|
(210,012) |
|
(169,688) |
|
Marketing and investor relations |
|
(415,642) |
|
(335,416) |
|
Consulting and directors' fees |
|
(446,882) |
|
(544,718) |
|
Depreciation |
|
(1,703) |
|
- |
|
Impairment of exploration expenditure |
9 |
(640,437) |
|
(209,122) |
|
Fair value adjustment on assets held at fair value through profit or loss |
6 |
(296,887)
|
|
(134,409) |
|
Share-based payments |
22 |
(18,471) |
|
- |
|
Other expenses |
3 |
(362,322) |
|
(309,832) |
|
|
|
|
|
|
|
(Loss) before tax from continuing operations |
|
(2,225,183) |
|
(1,667,524) |
|
Income tax expense |
|
- |
|
- |
|
(Loss) after tax from continuing operations |
|
(2,225,183) |
|
(1,667,524) |
|
|
|
|
|
|
|
Discontinued Operations |
|
|
|
|
|
Profit/(loss) from discontinued operations |
12 |
(233,026) |
|
205,675 |
|
(Loss) after tax for the year |
|
(2,458,209) |
|
(1,461,849) |
|
|
|
|
|
|
|
|
|
|
|
|
|
Other comprehensive income |
|
|
|
|
|
Items that may be reclassified subsequently to profit or loss |
|
|
|
|
|
Exchange differences on translation of foreign operations |
|
3,130 |
|
1,154 |
|
Total comprehensive (loss) for the year |
|
(2,455,079) |
|
(1,460,695) |
|
|
|
|
|
|
|
|
|
|
|
|
|
(Loss) per share from continuing operations |
14 |
|
|
|
|
Basic (cents per share) |
|
(0.16) |
|
(0.13) |
|
Diluted (cents per share) |
|
(0.16) |
|
(0.13) |
|
|
|
|
|
|
|
(Loss)/earnings per share from discontinued operations |
14 |
|
|
|
|
Basic (cents per share) |
|
(0.02) |
|
0.02 |
|
Diluted (cents per share) |
|
(0.02) |
|
0.02 |
|
|
|
|
|
|
The accompanying notes form part of these financial statements.
Consolidated Statement of Financial Position
as at 30 June 2025
|
|
Note |
30 June 2025 $ |
|
30 June 2024 $ |
|
Assets |
|
|
|
|
|
Current Assets |
|
|
|
|
|
Cash and cash equivalents |
5 |
1,847,191 |
|
1,118,294 |
|
Financial assets at fair value through profit or loss |
6 |
595,322 |
|
376,344 |
|
Other Assets |
7 |
86,215 |
|
420,707 |
|
Total Current Assets |
|
2,528,728 |
|
1,915,345 |
|
|
|
|
|
|
|
Non-Current Assets |
|
|
|
|
|
Property, plant and equipment |
8 |
5,181 |
|
- |
|
Other receivables |
7 |
53,861 |
|
314,361 |
|
Deferred exploration and evaluation expenditure |
9 |
8,728,609 |
|
8,493,010 |
|
Total Non-Current Assets |
|
8,787,651 |
|
8,807,371 |
|
Total Assets |
|
11,316,379 |
|
10,722,716 |
|
|
|
|
|
|
|
Current Liabilities |
|
|
|
|
|
Trade and other payables |
10 |
164,448 |
|
112,142 |
|
Total Current Liabilities |
|
164,448 |
|
112,142 |
|
Total Liabilities |
|
164,448 |
|
112,142 |
|
Net Assets |
|
11,151,931 |
|
10,610,574 |
|
|
|
|
|
|
|
Equity |
|
|
|
|
|
Issued capital |
11 |
38,821,620 |
|
35,964,396 |
|
Reserves |
13 |
4,225,231 |
|
4,082,889 |
|
Accumulated losses |
|
(31,894,920) |
|
(29,436,711) |
|
Total Equity |
|
11,151,931 |
|
10,610,574 |
|
|
||||
The accompanying notes form part of these financial statements.
Consolidated Statement of Changes in Equity
for the year ended 30 June 2025
|
|
|
Issued Capital $ |
Share-Based Payment Reserve $ |
Foreign Currency Translation Reserve $ |
Accumulated Losses $ |
Total $ |
|
Balance as at 1 July 2024 |
|
35,964,396 |
4,230,962 |
(148,073) |
(29,436,711) |
10,610,574 |
|
Loss for the year |
|
- |
- |
- |
(2,458,209) |
(2,458,209) |
|
Other comprehensive income |
|
- |
- |
3,130 |
- |
3,130 |
|
Total comprehensive loss for the year |
|
- |
- |
3,130 |
(2,458,209) |
(2,455,079) |
|
Shares issued to sophisticated investors |
|
2,898,750 |
- |
- |
- |
2,898,750 |
|
Shares issued to advisor |
|
78,570 |
- |
- |
- |
78,570 |
|
Share issue costs |
|
(216,096) |
120,741 |
- |
- |
(95,355) |
|
Shares based payments |
|
96,000 |
18,471 |
- |
- |
114,471 |
|
Balance at 30 June 2025 |
|
38,821,620 |
4,370,174 |
(144,943) |
(31,894,920) |
11,151,931 |
|
|
|
Issued Capital $ |
Share-Based Payment Reserve $ |
Foreign Currency Translation Reserve $ |
Accumulated Losses $ |
Total $ |
|
Balance as at 1 July 2023 |
|
35,964,396 |
4,230,962 |
(149,227) |
(27,974,862) |
12,071,269 |
|
Loss for the year |
|
- |
- |
- |
(1,461,849) |
(1,461,849) |
|
Other comprehensive loss |
|
- |
- |
1,154 |
- |
1,154 |
|
Total comprehensive loss for the year |
|
- |
- |
1,154 |
(1,461,849) |
(1,460,695) |
|
Balance at 30 June 2024 |
|
35,964,396 |
4,230,962 |
(148,073) |
(29,436,711) |
10,610,574 |
|
|
|
|
|
|
|
|
The accompanying notes form part of these financial statements.
Consolidated Statement of Cash Flows
for the year ended 30 June 2025
|
|
Note |
30 June 2025 $ |
|
30 June 2024 $ |
|
|
|
|
||
|
Cash flows from operating activities |
|
|
|
|
|
Payments to suppliers and employees |
|
(1,347,125) |
|
(1,193,574) |
|
Interest received |
|
26,369 |
|
32,261 |
|
Net cash (outflow) from operating activities |
5 |
(1,320,756) |
|
(1,161,313) |
|
|
|
|
|
|
|
Cash flows from investing activities |
|
|
|
|
|
Acquisition of plant and equipment |
|
(6,884) |
|
- |
|
Proceeds from the sale of financial assets at fair value through profit or loss |
6 |
652,757 |
|
- |
|
Receipts for tenements bonds |
|
440,600 |
|
- |
|
R&D tax incentive refund received |
|
203,761 |
|
- |
|
Cash paid for acquisition of Harts Range |
23 |
(125,000) |
|
- |
|
Payments for exploration and evaluation expenditure |
|
(623,375) |
|
(617,285) |
|
Net cash inflow/(outflow) from investing activities |
|
541,859 |
|
(617,285) |
|
|
|
|
|
|
|
Cash flows from financing activities |
|
|
|
|
|
Issued Capital |
|
1,589,250 |
|
- |
|
Share issue costs |
|
(95,355) |
|
- |
|
Net cash inflow from financing activities |
|
1,493,895 |
|
- |
|
|
|
|
|
|
|
Net increase/ (decrease) in cash and cash equivalents |
|
714,998 |
|
(1,778,598) |
|
Cash and cash equivalents at 1 July |
|
1,118,294 |
|
2,897,611 |
|
Effect of exchange rate fluctuations on cash held |
|
13,899 |
|
(719) |
|
Cash and cash equivalents at 30 June |
|
1,847,191 |
|
1,118,294 |
|
|
|
|
|
|
The accompanying notes form part of these financial statements.
Notes to the Consolidated Financial Statements
for the year ended 30 June 2025
NOTE 1: STATEMENT OF MATERIAL ACCOUNTING POLICIES
(a) Corporate Information
This general purpose financial report of
The nature of the operations and principal activities of the Group are described in the Directors' Report.
(b) Basis of Preparation
The financial report is a general-purpose financial report, which has been prepared in accordance with Australian Accounting Standards, Australian Accounting Interpretations, other authoritative pronouncements of the Australian Accounting Standards Board and the Corporations Act 2001. The Group is a for profit entity for financial reporting purposes under Australian Accounting Standards.
The financial report has been prepared on an accrual basis and is based on historical costs. Material accounting policies adopted in preparation of this financial report are presented below and have been consistently applied unless otherwise stated.
The presentation currency is Australian dollars.
(c) Adoption of new and revised standards
Standards and Interpretations applicable 30 June 2025
In the year ended 30 June 2025, the Directors have reviewed all of the new and revised Standards and Interpretations issued by the AASB that are relevant to the Company and effective for the current annual reporting period. As a result of this review, the Directors have determined that there is no material impact of the new and revised Standards and Interpretations on the Group and therefore, no material change is necessary to Group accounting policies.
Standards and interpretations issued, but not yet effective
The Directors have also reviewed all Standards and Interpretations issued, but not yet effective for the period 30 June 2025. As a result of this review the Directors have determined that there is no material impact of the Standards and Interpretations issued but not yet effective on the Company.
(d) Going concern
This report has been prepared on the going concern basis, which contemplates the continuity of normal business activity and the realisation of assets and settlement of liabilities in the normal course of business.
The Group incurred a net loss for the year ended 30 June 2025 of $2,458,214. and net cash outflows from operating activities of $1,320,756 net cash inflows from investing activities of $541,859 and net cash inflows from financing activities of $1,493,895. At 30 June 2025, the Group had a net asset position of $11,151,931. The cash and cash equivalents balance at 30 June 2024 was $1,847,191.
Notwithstanding these results, the Directors believe that the Company will be able to continue as a going concern and as a result the financial statements have been prepared on a going concern basis. The financial report has been prepared on the assumption that the Group is a going concern for the following reasons:
· the ability of the Group to scale back parts of its operations and reduce costs if required;
· the Board is of the opinion that the Group has, or shall have access to, sufficient funds to meet the planned corporate activities and working capital requirements; and
· as the Group is an ASX-listed entity, the Group has the ability to raise additional funds, if required.
In the event that the Group is unable to achieve the actions noted above, there is a material uncertainty that may cast significant doubt as to the Group's ability to continue as a going concern, and it may be required to realise its assets at amounts different to those currently recognised, settle liabilities other than in the ordinary course of business and make provisions for other costs which may arise as a result of cessation or curtailment of normal business operations.
The directors have reviewed the Group's financial position and are of the opinion that the use of the going concern basis of accounting is appropriate.
(e) Basis of consolidation
The consolidated financial statements comprise the financial statements of
Subsidiaries are all those entities (including special purpose entities) over which the Company has control. The Company controls an entity when the company is exposed to, or has rights to, variable returns from its involvement with the entity and has the ability to affect those returns through its power to direct the activities of the Group.
The financial statements of the subsidiaries are prepared for the same reporting period as the parent Company, using consistent accounting policies.
In preparing the consolidated financial statements, all intercompany balances and transactions, income and expenses and profit and losses resulting from intra-company transactions have been eliminated in full.
Subsidiaries are fully consolidated from the date on which control is obtained by the Company and cease to be consolidated from the date on which control is transferred out of the Company.
A change in the ownership interest of a subsidiary that does not result in a loss of control, is accounted for as an equity transaction.
(f) Foreign currency translation
(i) Functional and presentation currency
Items included in the financial statements of each of the Company's entities are measured using the currency of the primary economic environment in which the entity operates ('the functional currency'). The functional and presentation currency of
(ii) Transactions and balances
Foreign currency transactions are translated into the functional currency using the exchange rates prevailing at the dates of the transactions. Foreign exchange gains and losses resulting from the settlement of such transactions and from the translation at year‑end exchange rates of monetary assets and liabilities denominated in foreign currencies are recognised in the statement of comprehensive income.
(iii) Group entities
The results and financial position of all the Company entities (none of which has the currency of a hyperinflationary economy) that have a functional currency different from the presentation currency are translated into the presentation currency as follows:
· assets and liabilities for each statement of financial position presented are translated at the closing rate at the date of that statement of financial position;
· income and expenses for each statement of comprehensive income are translated at average exchange rates (unless this is not a reasonable approximation of the rates prevailing on the transaction dates, in which case income and expenses are translated at the dates of the transactions); and
· all resulting exchange differences are recognised as a separate component of equity.
On consolidation, exchange differences arising from the translation of any net investment in foreign entities are taken to foreign currency translation reserve. When a foreign operation is sold or any borrowings forming part of the net investment are repaid, a proportionate share of such exchange differences are recognised in the statement of comprehensive income, as part of the gain or loss on sale where applicable.
(g) Impairment of non-financial assets
The Group assesses at each reporting date whether there is an indication that an asset may be impaired. If any such indication exists, or when annual impairment testing for an asset is required, the Group makes an estimate of the asset's recoverable amount. An asset's recoverable amount is the higher of its fair value less costs to sell and its value in use and is determined for an individual asset, unless the asset does not generate cash inflows that are largely independent of those from other assets of the Group. In such cases the asset is tested for impairment as part of the cash generating unit to which it belongs. When the carrying amount of an asset or cash-generating unit exceeds its recoverable amount, the asset or cash-generating unit is considered impaired and is written down to its recoverable amount.
In assessing value in use, the estimated future cash flows are discounted to their present value using a pre-tax discount rate that reflects current market assessments of the time value of money and the risks specific to the asset. Impairment losses relating to continuing operations are recognised in those expense categories consistent with the function of the impaired asset unless the asset is carried at revalued amount (in which case the impairment loss is treated as a revaluation decrease).
An assessment is also made at each reporting date as to whether there is any indication that previously recognised impairment losses may no longer exist or may have decreased. If such indication exists, the recoverable amount is estimated. A previously recognised impairment loss is reversed only if there has been a change in the estimates used to determine the asset's recoverable amount since the last impairment loss was recognised. If that is the case the carrying amount of the asset is increased to its recoverable amount. That increased amount cannot exceed the carrying amount that would have been determined, net of depreciation, had no impairment loss been recognised for the asset in prior years. Such reversal is recognised in profit or loss unless the asset is carried at revalued amount, in which case the reversal is treated as a revaluation increase.
After such a reversal the depreciation charge is adjusted in future periods to allocate the asset's revised carrying amount, less any residual value, on a systematic basis over its remaining useful life.
(h) Exploration and evaluation expenditure
Exploration and evaluation expenditure incurred by or on behalf of the Group is accumulated separately for each area of interest. Such expenditure comprises net direct costs and an appropriate portion of related overhead expenditure but does not include general overheads or administrative expenditure not having a specific nexus with a particular area of interest.
Each area of interest is limited to a size related to a known or probable mineral resource capable of supporting a mining operation.
Exploration and evaluation expenditure for each area of interest is carried forward as an asset provided that one of the following conditions is met:
· such costs are expected to be recouped through successful development and exploitation of the area of interest or, alternatively, by its sale; or
· exploration and evaluation activities in the area of interest have not yet reached a stage which permits a reasonable assessment of the existence or otherwise of economically recoverable reserves, and active and significant operations in relation to the area are continuing.
Expenditure which fails to meet the conditions outlined above is impaired; furthermore, the Directors regularly review the carrying value of exploration and evaluation expenditure and make write downs if the values are not expected to be recoverable.
Identifiable exploration assets acquired are recognised as assets at their cost of acquisition, as determined by the requirements of AASB 6 Exploration for and evaluation of mineral resources. Exploration assets acquired are reassessed on a regular basis and these costs are carried forward provided that at least one of the conditions referred to in AASB 6 is met.
Exploration and evaluation expenditure incurred subsequent to acquisition in respect of an exploration asset acquired, is accounted for in accordance with the policy outlined above for exploration expenditure incurred by or on behalf of the entity.
Acquired exploration assets are not written down below acquisition cost until such time as the acquisition cost is not expected to be recovered.
When an area of interest is abandoned, any expenditure carried forward in respect of that area is written off.
Expenditure is not carried forward in respect of any area of interest/mineral resource unless the Group's rights of tenure to that area of interest are current.
(i) Trade and other receivables
Trade receivables, which generally have 30 - 90 day terms, are recognised and carried at original invoice amount less an allowance for any uncollectible amounts.
Impairment of trade receivables is continually reviewed and those that are considered to be uncollectible are written off by reducing the carrying amount directly. An allowance account is used when there is objective evidence that the Group will not be able to collect all amounts due according to the original contractual terms. Furthermore, the Group applies the simplified approach permitted by AASB 9, which requires expected lifetime losses to be recognised from initial recognition of the receivables. Factors considered by the Group in making this determination include known significant financial difficulties of the debtor, review of financial information and significant delinquency in making contractual payments to the Group. The impairment allowance is set equal to the difference between the carrying amount of the receivable and the present value of estimated future cash flows, discounted at the original effective interest rate. Where receivables are short-term, discounting is not applied in determining the allowance.
The amount of the impairment loss is recognised in the statement of comprehensive income within other expenses. When a trade receivable for which an impairment allowance had been recognised becomes uncollectible in a subsequent period, it is written off against the allowance account. Subsequent recoveries of amounts previously written off are credited against other expenses in the statement of comprehensive income.
(j) Cash and cash equivalents
Cash and short-term deposits in the statement of financial position include cash on hand and deposits held at call with banks. Bank overdrafts are shown as current liabilities in the statement of financial position. For the purpose of the statement of cash flows, cash and cash equivalents consist of cash and cash equivalents as described above.
(k) Investments and other financial assets
Investments and other financial assets are initially measured at fair value. Transaction costs are included as part of the initial measurement, except for financial assets at fair value through profit or loss. Such assets are subsequently measured at either amortised cost or fair value depending on their classification. Classification is determined based on both the business model within which such assets are held and the contractual cash flow characteristics of the financial asset unless an accounting mismatch is being avoided.
Financial assets are derecognised when the rights to receive cash flows have expired or have been transferred and the consolidated entity has transferred substantially all the risks and rewards of ownership. When there is no reasonable expectation of recovering part or all of a financial asset, its carrying value is written off.
Financial assets at fair value through profit or loss
Financial assets not measured at amortised cost or at fair value through other comprehensive income are classified as financial assets at fair value through profit or loss. Typically, such financial assets will be either: (i) held for trading, where they are acquired for the purpose of selling in the short-term with an intention of making a profit, or a derivative; or (ii) designated as such upon initial recognition where permitted. Fair value movements are recognised in profit or loss.
Financial assets at fair value through other comprehensive income
Financial assets at fair value through other comprehensive income include equity investments which the consolidated entity intends to hold for the foreseeable future and has irrevocably elected to classify them as such upon initial recognition.
Impairment of financial assets
The consolidated entity recognises a loss allowance for expected credit losses on financial assets which are either measured at amortised cost or fair value through other comprehensive income. The measurement of the loss allowance depends upon the consolidated entity's assessment at the end of each reporting period as to whether the financial instrument's credit risk has increased significantly since initial recognition, based on reasonable and supportable information that is available, without undue cost or effort to obtain.
Where there has not been a significant increase in exposure to credit risk since initial recognition, a 12-month expected credit loss allowance is estimated. This represents a portion of the asset's lifetime expected credit losses that is attributable to a default event that is possible within the next 12 months. Where a financial asset has become credit impaired or where it is determined that credit risk has increased significantly, the loss allowance is based on the asset's lifetime expected credit losses. The amount of expected credit loss recognised is measured on the basis of the probability weighted present value of anticipated cash shortfalls over the life of the instrument discounted at the original effective interest rate.
For financial assets mandatorily measured at fair value through other comprehensive income, the loss allowance is recognised in other comprehensive income with a corresponding expense through profit or loss. In all other cases, the loss allowance reduces the asset's carrying value with a corresponding expense through profit or loss.
(l) Provisions
Provisions are recognised when the Group has a present obligation (legal or constructive) as a result of a past event, it is probable that an outflow of resources embodying economic benefits will be required to settle the obligation and a reliable estimate can be made of the amount of the obligation.
Where the Group expects some or all of a provision to be reimbursed, for example under an insurance contract, the reimbursement is recognised as a separate asset but only when the reimbursement is virtually certain. The expense relating to any provision is presented in the statement of comprehensive income net of any reimbursement.
Provisions are measured at the present value or management's best estimate of the expenditure required to settle the present obligation at the end of the reporting period.
If the effect of the time value of money is material, provisions are determined by discounting the expected future cash flows at a pre-tax rate that reflects current market assessments of the time value of money, and where appropriate, the risks specific to the liability.
Where discounting is used, the increase in the provision due to the passage of time is recognised as a finance cost.
(m) Critical accounting estimates and judgements
Estimates and judgements are continually evaluated and are based on historical experience and other factors, including expectations of future events that may have a financial impact on the entity and that are believed to be reasonable under the circumstances.
The Group makes estimates and assumptions concerning the future. The resulting accounting estimates will, by definition, seldom equal the related actual results. The estimates and assumptions that have a significant risk of causing a material adjustment to the carrying amounts of assets and liabilities within the next financial year are discussed below.
Capitalised exploration and evaluation expenditure
The future recoverability of capitalised exploration and evaluation expenditure is dependent on a number of factors, including whether the Group decides to exploit the related lease itself or, if not, whether it successfully recovers the related exploration and evaluation asset through sale.
Factors which could impact the future recoverability include the level of proved, probable and inferred mineral resources, future technological changes which could impact the cost of mining, future legal changes (including changes to environmental restoration obligations) and changes to commodity prices.
To the extent that capitalised exploration and evaluation expenditure is determined not to be recoverable in the future, this will reduce profits and net assets in the period in which this determination is made. In addition, exploration and evaluation expenditure is capitalised if activities in the area of interest have not yet reached a stage which permits a reasonable assessment of the existence or otherwise of economically recoverable reserves. To the extent that it is determined in the
future that this capitalised expenditure should be written off, this will reduce profits and net assets in the period in which this determination is made.
Share-based payment transactions
The Group measures the cost of equity-settled transactions with employees by reference either the fair value of the equity instruments at the date at which they are granted. The fair value is determined by using a Black and Scholes model or trinomial model, using the assumptions detailed in note 11.
(n) Income tax
Deferred income tax is provided for on all temporary differences at balance date between the tax base of assets and liabilities and their carrying amounts for financial reporting purposes.
No deferred income tax will be recognised from the initial recognition of goodwill or of an asset or liability, excluding a business combination, where there is no effect on accounting or taxable profit or loss. No deferred income tax will be recognised in respect of temporary differences associated with investments in subsidiaries if the timing of the reversal of the temporary difference can be controlled and it is probable that the temporary differences will not reverse in the near future.
Deferred tax is calculated at the tax rates that are expected to apply to the period when the asset is realised or liability is settled. Deferred tax is credited in the statement of comprehensive income except where it relates to items that may be credited directly to equity, in which case the deferred tax is adjusted directly against equity. Deferred income tax assets are recognised for all deductible temporary differences, carry forward of unused tax assets and unused tax losses to the extent that it is probable that future tax profits will be available against which deductible temporary differences can be utilised.
The amount of benefits brought to account or which may be realised in the future is based on tax rates (and tax laws) that have been enacted or substantially enacted at the balance date and the anticipation that the Group will derive sufficient future assessable income to enable the benefit to be realised and comply with the conditions of deductibility imposed by the law. The carrying amount of deferred tax assets is reviewed at each balance date and only recognised to the extent that sufficient future assessable income is expected to be obtained. Income taxes relating to items recognised directly in equity are recognised in equity and not in the statement of comprehensive income.
(o) Issued capital
Ordinary shares are classified as equity. Incremental costs directly attributable to the issue of new shares or options are shown in equity as a deduction, net of tax, from the proceeds.
(p) Interest Income
Revenue is recognised as the interest accrues (using the effective interest method, which is the rate that exactly discounts estimated future cash receipts through the expected life of the financial instrument) to the net carrying amount of the financial asset.
(q) Earnings / loss per share
Basic earnings / loss per share
Basic earnings / loss per share is calculated by dividing the profit/loss attributable to equity holders of the Group, excluding any costs of servicing equity other than dividends, by the weighted average number of ordinary shares, adjusted for any bonus elements.
Diluted earnings / loss per share
Diluted earnings / loss per share is calculated as net profit/loss attributable to members of the Group, adjusted for:
· costs of servicing equity (other than dividends) and preference share dividends;
· the after tax effect of dividends and interest associated with dilutive potential ordinary shares that have been recognised as expenses; and
· other non-discretionary changes in revenues or expenses during the period that would result from the dilution of potential ordinary shares; and
· divided by the weighted average number of ordinary shares and dilutive potential ordinary shares, adjusted for any bonus elements.
(r) Goods and services tax
Revenues, expenses and assets are recognised net of the amount of GST, except where the amount of GST incurred is not recoverable from the Australian Tax Office. In these circumstances the GST is recognised as part of the cost of acquisition of the asset or as part of an item of the expense. Receivables and payables in the statement of financial position are shown inclusive of GST.
The net amount of GST recoverable from, or payable to, the Australian Tax Office is included as part of receivables or payables in the statement of financial position.
Cash flows are presented in the statement of cash flows on a gross basis, except for the GST component of investing and financing activities, which are disclosed as operating cash flows.
(s) Trade and other payables
Liabilities for trade creditors and other amounts are measured at amortised cost, which is the fair value of the consideration to be paid in the future for goods and services received that are unpaid, whether or not billed to the Group.
(t) Share-based payment transactions
The Group provides benefits to individuals acting as, and providing services similar to employees (including Directors) of the Group in the form of share based payment transactions, whereby individuals render services in exchange for shares or rights over shares ('equity settled transactions').
The cost of these equity settled transactions with employees is measured by reference to the fair value at the date at which they are granted. The fair value is determined by using the Black Scholes formula taking into account the terms and conditions upon which the instruments were granted, as discussed in note 11.
In valuing equity settled transactions, no account is taken of any performance conditions, other than conditions linked to the price of the shares of
The cost of the equity settled transactions is recognised, together with a corresponding increase in equity, over the period in which the performance conditions are fulfilled, ending on the date on which the relevant employees become fully entitled to the award ('vesting date').
The cumulative expense recognised for equity settled transactions at each reporting date until vesting date reflects (i) the extent to which the vesting period has expired and (ii) the number of awards that, in the opinion of the Directors of the Group, will ultimately vest. This opinion is formed based on the best available information at balance date. No adjustment is made for the likelihood of the market performance conditions being met as the effect of these conditions is included in the determination of fair value at grant date. The statement of comprehensive income charge or credit for a period represents the movement in cumulative expense recognised at the beginning and end of the period.
No expense is recognised for awards that do not ultimately vest, except for awards where vesting is conditional upon a market condition.
Where the terms of an equity settled award are modified, as a minimum, an expense is recognised as if the terms had not been modified. In addition, an expense is recognised for any increase in the value of the transaction as a result of the modification, as measured at the date of the modification.
Where an equity settled award is cancelled, it is treated as if it had vested on the date of the cancellation, and any expense not yet recognised for the award is recognised immediately. However, if a new award is substituted for the cancelled award, and designated as a replacement award on the date that it is granted, the cancelled and new award are treated as if they were a modification of the original award, as described in the previous paragraph. The cost of equity-settled transactions with non-employees is measured by reference to the fair value of goods and services received unless this cannot be measured reliably, in which case the cost is measured by reference to the fair value of the equity instruments granted. The dilutive effect, if any, of outstanding options is reflected in the computation of loss per share (see note 14).
(u) Comparative information
When required by Accounting Standards, comparative information has been reclassified to be consistent with the presentation in the current year.
(v) Operating segments
Operating segments are presented using the 'management approach', where the information presented is on the same basis as the internal reports provided to the Chief Operating Decision Makers ('CODM'). The CODM is responsible for the allocation of resources to operating segments and assessing their performance.
(w) Discontinued operations
A discontinued operation is a component of the consolidated entity that has been disposed of or is classified as held for sale and that represents a separate major line of business or geographical area of operations, is part of a single co-ordinated plan to dispose of such a line of business or area of operations, or is a subsidiary acquired exclusively with a view to resale. The results of discontinued operations are presented separately on the face of the statement of profit or loss and other comprehensive income.
(x) Fair value measurement
When an asset or liability, financial or non-financial, is measured at fair value for recognition or disclosure purposes, fair value is based on the price that would be received to sell an asset or paid to transfer a liability in an orderly transaction between market participants at the measurement date; and assumes that the transaction will take place either: in the principle market; or in the absence of a principal market, in the most advantageous market.
Fair value is measured using the assumptions that market participants would use when pricing the asset or liability, assuming they act in their economic best interest. For non-financial assets, the fair value measurement is based on its highest and best use. Valuation techniques that are appropriate in the circumstances and for which sufficient data are available to measure fair value, are used, maximising the use of relevant observable inputs and minimising the use of unobservable inputs.
Assets and liabilities measured at fair value are classified, into three levels, using a fair value hierarchy that reflects the significance of the inputs used in making the measurements. Classifications are reviewed each reporting date and transfers between levels are determined based on a reassessment of the lowest level input that is significant to the fair value measurement.
For recurring and non-recurring fair value measurements, external valuers may be used when internal expertise is either not available or when the valuation is deemed to be significant. External valuers are selected based on market knowledge and reputation.
Where there is a significant change in fair value of an asset or liability from one period to another, an analysis is undertaken, which includes a verification of the major inputs applied in the latest valuation and a comparison, where applicable, with external sources of data.
(y) Parent entity financial information
The financial information for the parent entity,
Investments in subsidiaries, associates and joint venture entities
Investments in subsidiaries, associates and joint venture entities are accounted for at cost in the parent entity's financial statements. Dividends received from associates are recognised in the parent entity's profit or loss, rather than being deducted from the carrying amount of these investments.
NOTE 2: SEGMENT REPORTING
Management has determined the operating segments based on the reports reviewed by the Board of Directors that are used to make strategic decisions. During the 2025 financial year, the entity had five geographical segments being exploration in
|
June 2025 |
NWQ (QLD) |
Cangai (NSW) (discontinued) |
Broken Hill (NSW) (discontinued) |
Harts Range (NT) |
|
Unallocated |
Total |
|
|
Segment assets and liabilities |
$ |
$ |
$ |
$ |
$ |
$ |
$ |
|
|
Current assets |
- |
- |
- |
- |
- |
2,528,728 |
2,528,728 |
|
|
Non-current assets |
6,782,621 |
- |
- |
1,999,728 |
- |
5,302 |
8,787,651 |
|
|
Current liabilities |
- |
- |
- |
- |
- |
(164,448) |
(164,448) |
|
|
|
|
|
|
|
|
|
|
|
|
Segment income and expenses |
|
|
|
|
|
|
|
|
|
Interest income |
- |
- |
- |
- |
- |
22,969 |
22,969 |
|
|
Other income |
- |
727,926 |
6,845 |
- |
- |
144,204 |
878,975 |
|
|
Impairment expense |
- |
- |
(967,797) |
- |
(640,437) |
- |
(1,608,234) |
|
|
Depreciation expense |
- |
- |
- |
(1,703) |
- |
- |
(1,703) |
|
|
Other expenses |
- |
- |
- |
- |
(40,489) |
(1,709,727) |
(1,750,216) |
|
|
Total |
- |
727,926 |
(960,952) |
(1,703) |
(680,926) |
(1,542,554) |
(2,458,209) |
|
|
June 2024 |
NWQ (QLD) |
Cangai (NSW) |
Broken Hill (NSW) |
|
Unallocated |
Total |
|
Segment assets and liabilities |
$ |
$ |
$ |
$ |
$ |
$ |
|
Current assets |
- |
152,600 |
20,000 |
- |
1,742,745 |
1,915,345 |
|
Non-current assets |
6,690,813 |
168,500 |
1,316,415 |
631,522 |
122 |
8,807,371 |
|
Current liabilities |
- |
- |
- |
- |
(112,142) |
(112,142) |
|
|
|
|
|
|
|
|
|
Segment income and expenses |
|
|
|
|
|
|
|
Interest income |
- |
- |
- |
- |
35,661 |
35,661 |
|
Other Income |
- |
- |
415,922 |
- |
- |
415,922 |
|
Other expenses |
- |
(210,247) |
- |
(228,616) |
(1,474,569) |
(1,913,432) |
|
Total |
- |
(210,247) |
415,922 |
(228,616) |
(1,438,908) |
(1,461,849) |
NOTE 3: OTHER INCOME AND EXPENSES
Included in other expenses are the following items:
|
|
2025 |
2024 |
|
Other Income |
|
|
|
Gain on sale of financial assets |
144,204 |
- |
|
Total Other Income |
144,204 |
- |
|
|
|
|
|
Other Expenses |
|
|
|
Accounting and audit expense |
153,600 |
163,150 |
|
Administrative expenses |
65,692 |
44,583 |
|
Insurance |
74,253 |
74,609 |
|
Foreign exchange losses/(gains) |
(13,897) |
720 |
|
Legal fees |
3,728 |
25,433 |
|
Travel and accommodation |
74,753 |
1,327 |
|
Other |
4,193 |
10 |
|
Total Other Expenses |
362,322 |
309,832 |
NOTE 4: INCOME TAX
|
|
|
|
2025 $ |
2024 $ |
|||
|
(a) Income tax expense/(benefit) |
|||||||
|
Major component of tax expense for the year: |
|
|
|
|
|
||
|
Current tax |
|
|
|
- |
- |
||
|
Deferred tax |
|
|
|
- |
- |
||
|
|
|
|
|
- |
- |
||
|
|
2025 |
2024 |
||||||
|
(b) Numerical reconciliation between aggregate tax expense recognised in the statement of comprehensive income and tax expense calculated per the statutory income tax rate |
|
|
|
|
||||
|
A reconciliation between tax expense and the product of accounting result before income tax multiplied by the Group's applicable tax rate is as follows: |
|
|
|
|
||||
|
Loss from continuing operations before income tax expense |
|
(2,458,209) |
(1,461,849) |
|
||||
|
Tax at the Australian rate of 25% (2024: 25%) |
|
(614,552) |
(365,462) |
|
||||
|
Non-allowable expenses |
|
12,531 |
1,872 |
|
||||
|
Income tax benefit not bought to account |
|
602,021 |
363,590 |
|
||||
|
Income tax expense |
|
- |
- |
|
||||
|
|
|
|
|
|
||||
|
(c) The following deferred tax balances have not been bought to account: |
|
2025 |
2024 |
|
||||
|
Assets |
|
$ |
$ |
|
||||
|
Total losses available to offset against future taxable income |
|
7,034,357 |
6,539,166 |
|
||||
|
Total accrued expenses |
|
9,873 |
9,699 |
|
||||
|
Total share issue costs deductible over five years |
|
12,449 |
111,651 |
|
||||
|
Liabilities |
|
|
|
|
||||
|
Prepayments |
|
(10,453) |
(10,102) |
|
||||
|
Financial assets held at fair value through profit or loss |
|
(74,222) |
(33,323) |
|
||||
|
Deferred tax liability on capitalised exploration costs |
|
(2,236,808) |
(2,136,828) |
|
||||
|
Deferred tax assets not brought to account as realisation is not regarded as probable |
|
(4,735,196) |
(4,480,262) |
|
||||
|
Deferred tax asset recognised |
|
- |
- |
|
||||
|
|
|
|
|
|
||||
|
|
|
2025 |
2024 |
|
||||
|
|
|
$ |
$ |
|
||||
|
(d) Unused tax losses |
|
|
|
|
||||
|
Unused tax losses |
|
28,137,429 |
26,156,655 |
|
||||
|
Potential tax benefit not recognised at 25% (2024: 25%) |
|
7,034,357 |
6,539,166 |
|
||||
The benefit for tax losses will only be obtained if:
(i) the Group derives future assessable income in
(ii) the Group continues to comply with the conditions for deductibility imposed by tax legislation in
(iii) no changes in tax legislation in
NOTE 5: CASH AND CASH EQUIVALENTS
|
(a) Reconciliation of operating loss after tax to net the cash flows used in operations |
2025 $ |
2024 $ |
|
||||||
|
Loss from ordinary activities after tax |
|
(2,458,209) |
(1,461,849) |
|
|||||
|
Non-cash items |
|
|
|
|
|
||||
|
Depreciation |
|
1,703 |
- |
|
|||||
|
Share-based payments |
|
18,471 |
- |
|
|||||
|
Consultancy and adviser fees settled in shares |
|
96,000 |
- |
|
|||||
|
Loss on revaluation of financial assets held at fair value through profit or loss |
|
296,887 |
134,409 |
|
|||||
Impairment expense |
|
|
1,608,234 |
419,369 |
|
||||
Foreign exchange loss/(gain) |
|
|
(10,766) |
1,874 |
|
||||
Profit & loss items classed as investing activities |
|
|
|
|
|
||||
Consulting fees relating to exploration expenditure |
|
|
- |
163,515 |
|
||||
(Profit)/Loss on the sale of non current asset |
|
|
(739,304) |
(415,922) |
|
||||
(Profit)/Loss on the sale of shares |
|
|
(144,204) |
- |
|
||||
Changes in assets and liabilities |
|
|
|
|
|
||||
|
(Decrease) / increase in trade and other payables |
|
29,443 |
(15,682) |
|
|||||
|
(Increase) in other receivables |
|
|
|
(19,011) |
12,973 |
|
|||
|
Net cash flow used in operating activities |
|
|
|
(1,320,756) |
(1,161,313) |
|
|||
|
(b) Reconciliation of cash |
|
|
|
|
|
|
|||
|
Cash balance comprises: |
|
|
|
|
|
|
|
||
|
Cash at bank |
|
|
|
|
1,847,191 |
718,294 |
|
||
|
Term deposits |
|
|
|
|
- |
400,000 |
|
||
|
Total |
|
|
|
|
1,847,191 |
1,118,294 |
|
||
Cash at bank earns interest at floating rates based on daily bank deposit rates.
(c) Non-cash Investing and Financing Activities
|
|
2025 |
2024 |
|
Shares issued on acquisition of Audax Holdings Pty Ltd (Refer to Note 23) |
(1,388,070) |
- |
|
Sale of Exploration Assets for Shares (Refer to Note 12) |
1,024,418 |
- |
|
Total |
(363,652) |
- |
NOTE 6: FINANCIAL ASSETS AT FAIR VALUE THROUGH PROFIT OR LOSS
|
|
CURRENT |
2025 |
2024 |
|
Listed ordinary shares - designated at fair value through profit or loss |
513,322 |
376,344 |
|
|
Unlisted options - designated at fair value through profit or loss |
82,000 |
- |
|
|
Total |
595,322 |
376,344 |
|
RECONCILIATION
Reconciliation of the fair values at the beginning and end of the current and previous period are set out below:
|
|
|
2025 |
2024 |
|
Opening fair value |
376,344 |
- |
|
|
Additions (refer to note 12) |
1,024,418 |
510,753 |
|
|
Fair value adjustments |
(296,887) |
(134,409) |
|
|
Disposals |
(508,553) |
- |
|
|
Closing balance |
595,322 |
376,344 |
|
Ordinary shares held at fair value through profit or loss are measured at fair value based on quoted prices (unadjusted) in active markets for identical assets that the entity can access at the measurement date (level 1 in the fair value hierarchy). Options held at fair value through profit or loss are measured at fair value based on the Black and Scholes valuation method using various inputs (level 2 in the fair value hierarchy).
NOTE 7: OTHER ASSETS
|
|
|
2025 |
2024 |
|
Current |
|
|
|
|
GST/VAT receivable |
|
44,402 |
21,544 |
|
Prepayments |
|
41,813 |
40,408 |
|
Accrued interest |
|
- |
3,400 |
|
Tenement guarantees1 |
|
- |
172,600 |
|
R&D Tax Incentive receivable |
|
- |
182,755 |
|
|
|
86,215 |
420,707 |
|
Non-Current |
|
|
|
|
Tenement guarantees |
|
53,861 |
314,361 |
|
|
|
53,861 |
314,361 |
1 Current tenement guarantees relate to security deposits that were refunded by the New South Wales State Government in August 2024.
NOTE 8: PROPERTY, PLANT AND EQUIPMENT
|
|
|
2025 |
2024 |
|
Plant and equipment - at cost |
6,884 |
- |
|
|
Less: Accumulated depreciation |
(1,703) |
- |
|
|
Closing balance |
5,181 |
- |
|
NOTE 9: DEFERRED EXPLORATION AND EVALUATION EXPENDITURE
|
|
Exploration and evaluation phase: |
2025 |
2024 |
|
Opening balance |
8,493,010 |
8,736,198 |
|
|
Exploration and evaluation expenditure during the period |
605,763 |
453,768 |
|
|
Exploration and evaluation expenditure on acquisition of Audax Holdings Pty Ltd (refer to note 23) |
1,513,070 |
- |
|
|
R&D Tax Incentive receivable relating to capitalised exploration expenditure |
- |
(182,756) |
|
|
Impairment1 |
(1,608,234) |
(419,369) |
|
|
Sale of exploration assets (refer to note 12) |
(275,000) |
(94,831) |
|
|
Closing balance |
8,728,609 |
8,493,010 |
|
The ultimate recoupment of costs carried forward as exploration and evaluation expenditure is dependent on the successful development and commercial exploitation or sale of the respective areas of interest.
1 At the reporting date, the Group undertakes an assessment of the carrying amount of its exploration and evaluation assets. During the period, the Group identified indicators of impairment on exploration and evaluation assets under AASB 6 Exploration and Evaluation of Mineral Resources.
Broken Hill Tenements
As disclosed in Note 12, the Broken Hill tenements were sold during the 2025 financial year. As a result, the carrying value of these tenements were impaired to $275,000 being the value of consideration received, resulting in an impairment charge of $967,797.
Zambia Mkushi Tenement
As disclosed in Note 24, subsequent to the balance date, the Zambia Mkushi tenement has been released by the Group. As a result, the carrying value of the tenement at balance date was impaired to nil, resulting in an impairment charge of $640,437. The Zambia Mkushi tenement will be treated as a discontinued operation in the following financial period.
NOTE 10: TRADE AND OTHER PAYABLES
|
|
|
|
|
2025 |
2024 |
|
Current |
|
|
|
|
|
|
Trade and other payables |
|
|
|
132,448 |
81,642 |
|
Accruals |
|
|
|
32,000 |
30,500 |
|
|
|
|
|
164,448 |
112,142 |
Trade and other payables are non-interest bearing and payable on demand. Due to their short-term nature, the carrying value of trade and other payables is assumed to approximate their fair value.
NOTE 11: ISSUED CAPITAL
|
|
2025 |
2024 |
Issued and paid-up capital
|
Issued and fully paid |
38,821,620 |
35,964,396 |
|
|
2025 |
2024 |
||
|
|
Number of shares |
$ |
Number of shares |
$ |
Movements in issued capital
|
Opening balance |
1,299,505,355 |
35,964,396 |
1,299,505,355 |
35,964,396 |
|
Shares issued to sophisticated investors |
144,477,270 |
1,589,250 |
- |
- |
|
Share issued to consultants |
7,000,000 |
96,000 |
- |
- |
|
Shares issued for acquisition of Harts Range tenements (refer to Note 23) |
154,230,000 |
1,388,070 |
- |
- |
|
Transaction costs on share issued |
- |
(216,096) |
- |
- |
|
Closing balance |
1,605,212,625 |
38,821,620 |
1,299,505,355 |
35,964,396 |
Ordinary Shares
The Group does not have authorised capital nor par value in respect of its issued capital. Ordinary shares have the right to receive dividends as declared and, in the event of a winding up of the Company, to participate in the proceeds from sale of all surplus assets in proportion to the number of and amounts paid up on shares held. Ordinary shares entitle their holder to one vote, either in person or proxy, at a meeting of the Company.
Share Options
At 30 June 2025, there were 20,000,000 (30 June 2024: 11,000,000) unlisted options and no (30 June 2024: 163,439,781) listed options.
The following share-based payment arrangements were in place during the period:
|
Series |
Number |
Grant date |
Expiry date |
Exercise price |
Fair value at grant date |
Vesting date |
Listed/ Unlisted |
|
1 |
20,000,000 |
16 June 2025 |
10 June 2028 |
$0.0165 |
$0.0104 |
16 June 2025 |
Unlisted |
These options were issued to CPS Capital for lead manager services for the capital raising in June 2025. The options have been valued using the Black and Scholes option pricing model with inputs to the model based on the above terms as well as the following:
|
Expected volatility (%) |
100 |
|
Risk-free interest rate (%) |
3.475 |
|
Grant date share price (cents) |
0.011 |
The value of $120,740 has been applied against capital raised as transaction costs.
During the financial year 174,439,781 options expired, with various exercise prices and expiry dates.
No options were exercised during the period.
As at the date of this report, there were 23,500,000 unissued ordinary shares under unlisted options.
Performance Rights
In the 2024 Annual General Meeting held, shareholder approval was granted for the issue of 14,000,000 performance rights to the directors and company secretary with vesting conditions to achieve and maintain a 20 days VWAP of $0.020 or more on or before the expiry date.
The following share-based payment arrangements for performance rights were in place during the period:
|
Number |
Grant date |
Expiry date |
Exercise price |
Fair value at grant date |
Vesting date |
|
14,000,000 |
29 November 2024 |
19 January 2030 |
$Nil |
$0.0116 |
19 January 2025 |
No performance rights were exercised during the period.
The fair value of the above equity-settled performance rights granted was estimated as at the date of grant using the Trinomial calculation model taking into account the terms and conditions upon which they were granted, as follows:
|
Expected volatility (%) |
100 |
|
Risk-free interest rate (%) |
3.98 |
|
Expected life of rights (years) |
5 |
|
Grant date share price (cents) |
0.012 |
The expected volatility reflects the assumption that the historical volatility is indicative of future trends, which may also not necessarily be the actual outcome. No other features of rights granted were incorporated into the measurement of fair value. The total value of the rights is $162,772 and is being expensed over the term from grant date to expiry date. The expense for the year ended 30 June 2025 is $18,471.
Performance Shares
At 30 June 2025, none of the conditions of the performance shares disclosed in the 2024 year annual report were met. As a result, all performance shares have now expired.
NOTE 12: DISCONTINUED OPERATIONS
Cangai Copper Mine Project
On 30 December 2024 the sale of the Company's Cangai Copper Mine Project in NSW, to Infinity Mining Limited (ASX: IMI) as announced on 3 October 2024 was completed. As consideration for the sale, the Group received 40,000,000 shares in IMI with a value of $600,000, along with 20 million unlisted options with an exercise price of 7 cents and an expiry date of 30 November 2029 valued at $160,000. As the capitalised exploration expenditure has been fully impaired, a gain on sale of exploration assets of $760,000 has been recognised in the statement of profit or loss and other comprehensive income. As the project was considered to be a separate segment, it has been treated as a discontinued operation.
Broken Hill East Project
On 10 March 2025, the sale of Broken Hill East Project in NSW, to Impact Minerals Limited (ASX: IPT) as announced on the same date was completed. As consideration for the sale, the Group received 37,774,040 shares in IPT valued at $264,418 on the date of issuance. As the capitalised exploration expenditure has been partially impaired, a loss on sale of exploration assets of $10,582 has been recognised in the statement of profit or loss and other comprehensive income. As the project was considered to be a separate segment, it has been treated as a discontinued operation.
Financial Performance of Discontinued Operations:
|
|
|
2025 $
|
2024 $ |
|
|
Cangai |
|
|
|
|
|
Consideration received - shares |
|
760,000 |
- |
|
|
Exploration expenditure as incurred |
|
(32,074) |
- |
|
|
Impairment of exploration expenditure |
|
- |
(210,247) |
|
|
Cangai Profit/(Loss) for the year |
|
727,926 |
(210,247) |
|
|
|
|
|
|
|
|
Broken Hill |
|
|
|
|
|
Consideration received - shares |
|
264,418 |
510,753 |
|
|
Carrying amount of net asset disposed |
|
(275,000) |
(94,831) |
|
|
Exploration income/(expenditure) as incurred |
17,427 |
- |
|
|
|
Impairment of exploration expenditure |
|
(967,797) |
- |
|
|
BHA Profit/(Loss) for the year |
|
(960,952) |
415,922 |
|
|
|
|
|
|
|
|
Profit/(Loss) for the year |
|
(233,026) |
205,675 |
|
NOTE 13: RESERVE
Share based payment reserve
The share based payment reserve is used to record the value of equity benefits provided to Directors and executives as part of their remuneration and non-employees for their services.
Foreign currency translation reserve
The foreign exchange differences arising on translation of balances originally denominated in a foreign currency into the functional currency are taken to the foreign currency translation reserve. The reserve is recognised in profit or loss when the net investment is disposed of.
NOTE 14: LOSS PER SHARE
|
|
|
June 2025 $ |
June 2024 $ |
|
|
Earnings per share for profit from continuing operations |
|
|
|
|
Loss used in calculating basic and dilutive EPS |
(2,225,183) |
(1,667,524) |
|
Basic and diluted loss per share (cents per share) |
(0.16) |
(0.13) |
|
|
Earnings per share for profit from discontinued operations |
$ |
$ |
|
Loss used in calculating basic and dilutive EPS |
(233,026) |
205,675 |
|
|
Basic and diluted loss per share (cents per share) |
(0.02) |
0.02 |
|
|
|
|
|
|
|
|
|
Number of Shares |
|
|
|
Weighted average number of ordinary shares used in calculating basic loss per share: |
1,412,156,135 |
1,299,505,355 |
|
|
June 2025 $ |
June 2024 $ |
||||
|
|
Effect of dilution: |
|
|
|||
|
|
Share options |
- |
- |
|||
|
|
Adjusted weighted average number of ordinary shares used in calculating diluted loss per share: |
1,412,156,135 |
1,299,505,355 |
|||
|
|
|
|
|
|
|
|
There have been no transactions involving ordinary shares or potential ordinary shares that would significantly change the number of ordinary shares or potential ordinary shares outstanding between the reporting date and the date of completion of these financial statements.
There are no potential ordinary shares on issue that are considered to be dilutive, therefore basic earnings per share also represents diluted earnings per share.
NOTE 15: AUDITOR'S REMUNERATION
The auditor of
Amounts received or due and receivable for:
|
|
|
2025 |
2024 |
|
|
|
$ |
$ |
|
Audit or review of the financial reports |
|
53,005 |
50,599 |
|
|
|
53,005 |
50,599 |
NOTE 16: RELATED PARTY DISCLOSURES
Key management personnel
|
|
|
|
|
2025 |
2024 |
|
Compensation of key management personnel |
|
$ |
$ |
||
Short-term employee benefits |
|
|
|
247,377 |
322,948 |
Post-employment benefits |
|
|
|
- |
14,380 |
Share-based payments |
|
|
|
15,831 |
- |
Total remuneration |
|
|
|
263,208 |
337,328 |
a) Subsidiaries
The consolidated financial statements incorporate the assets, liabilities and results of New Frontier Minerals Limited and the following subsidiaries:
Name of Entity |
Country of Incorporation |
Equity Holding |
|
|
|
|
2025 |
2024 |
Castillo Copper Chile SPA |
|
100% |
100% |
Audax Holdings Pty Ltd |
|
100% |
0% |
Castillo Exploration Pty Ltd |
|
100% |
100% |
Qld Commodities Pty Ltd |
|
100% |
100% |
Total Iron Pty Ltd |
|
100% |
100% |
Total Minerals Pty Ltd |
|
100% |
100% |
BHA No. 1 Pty Ltd |
|
0% |
100% |
Atlantica Holdings (
|
|
75% |
75% |
Zed Copper Pty Ltd |
|
100% |
100% |
Chalo Mining Group Limited |
|
100% |
100% |
Lufilian Resources Zambia Limited |
|
0% |
100% |
Belmt Resources Mining Company Limited |
|
0% |
50% |
NOTE 17:
Exposure to liquidity, interest rate, price, credit, and foreign exchange risk arises in the normal course of the Group's business. The Group does not hold or use derivative financial instruments. The Group's principal financial instruments comprise mainly of deposits with banks. The totals for each category of financial instruments are as follows:
|
|
|
2025 $ |
2024 $ |
Financial Assets |
|
|
|
Cash and cash equivalents |
|
1,847,191 |
1,118,294 |
Financial assets at fair value through profit or loss |
|
595,322 |
376,344 |
Other receivables (current and non-current) |
|
98,263 |
694,660 |
Financial Liabilities |
|
2,540,776 |
2,189,298 |
Trade and other payables |
|
164,448 |
112,142 |
The Group uses different methods as discussed below to manage risks that arise from these financial instruments. The objective is to support the delivery of the financial targets while protecting future financial security.
(a) Capital risk management
The Group's capital comprises share capital and reserves less accumulated losses. As at 30 June 2025, the Group has net assets of $11,151,931 (2024: $10,610,574). The Group manages its capital to ensure its ability to continue as a going concern and to optimise returns to its shareholders.
(b) Liquidity risk
Liquidity risk is the risk that the Group will encounter difficulty in meeting obligations associated with financial liabilities. The Group manages liquidity risk by maintaining sufficient cash facilities to meet the operating requirements of the business and investing excess funds in highly liquid short term investments. The responsibility for liquidity risk management rests with the Board of Directors.
Alternatives for sourcing future capital needs include the cash position and future equity raising alternatives. These alternatives are evaluated to determine the optimal mix of capital resources for our capital needs. The Board expects that, assuming no material adverse change in a combination of our sources of liquidity, present levels of liquidity will be adequate to meet expected capital needs.
Maturity analysis for financial liabilities
Financial liabilities of the Group comprise trade and other payables. As at 30 June 2025 any financial liabilities that are contractually maturing within 60 days have been disclosed as current. Trade and other payables that have a deferred payment date of greater than 12 months have been disclosed as non-current.
(c) Interest rate risk
Interest rate risk arises from the possibility that changes in interest rates will affect future cash flows or the fair value of financial instruments. The Group's exposure to changes to interest rate risk relates primarily to its earnings on cash.
|
|
|
|
2025 |
2024 |
|
|
|
|
$ |
$ |
Cash and cash equivalents |
|
|
1,847,191 |
1,118,294 |
Interest rate sensitivity
The following table demonstrates the sensitivity of the Group's statement of comprehensive income to a reasonably possible change in interest rates, with all other variables constant.
Change in basis points |
Effect on post tax loss ($)Increase/(Decrease) |
Effect on equity including retained earnings ($) Increase/(Decrease) |
||
|
|
2025 |
2024 |
2025 |
2024 |
Increase 100 basis points |
18,472 |
11,183 |
18,472 |
11,183 |
Decrease 100 basis points |
(18,472) |
(11,183) |
(18,472) |
(11,183) |
A sensitivity of 100 basis points has been used as this is considered reasonable given the current level of both short term and long term Australian Dollar interest rates. This would represent two to four movements by the
(d) Price risk
The Group is exposed to price risk through its short-term holding of Australian shares (all listed on the ASX). The sensitivity analysis of the Group's exposure to price risk is as follows:
% change |
Effect on post tax loss ($)Increase/(Decrease) |
Effect on equity including retained earnings ($) Increase/(Decrease) |
|
||
|
|
2025 |
2024 |
2025 |
2024 |
|
Increase 100% |
595,322 |
376,344 |
595,322 |
376,344 |
|
Decrease 100% |
(595,322) |
(376,344) |
(595,322) |
(376,344) |
|
(e) Fair value measurement
Other than financial assets held at fair value through the profit or loss (refer Note 6), there were no financial assets or liabilities at 30 June 2025 requiring fair value estimation and disclosure as they are either not carried at fair value or in the case for short term assets and liabilities, their carrying values approximate fair value.
(f) Credit risk exposures
Credit risk represents the risk that the counterparty to the financial instrument will fail to discharge an obligation and cause the Group to incur a financial loss. The Group's maximum credit exposure is the carrying amounts on the statement of financial position. The Group holds financial instruments with credit worthy third parties.
At 30 June 2025, the Group held cash at bank. These were held with financial institutions with a rating from Standard & Poor's of AA- or above (long term). The Group has no past due or impaired debtors as at 30 June 2025.
(g) Foreign exchange
The Group undertakes certain transactions denominated in foreign currencies hence exposures to exchange rate fluctuations arise. The Group does not manage these exposures with foreign currency derivative products. The carrying amounts of the Group's foreign currency denominated monetary assets and monetary liabilities at the balance date expressed in Australian dollars are as follows:
|
Chilean Peso (CLP) |
|
|
|
|
2025
|
2024
|
Assets |
90,277 |
88,392 |
Liabilities |
(10,810) |
(10,584) |
|
|
79,467 |
77,808 |
|
British Pound Sterling (GBP) |
|
|
|
|
2025
|
2024
|
Assets |
906 |
322,120 |
Liabilities |
- |
- |
|
|
906 |
322,120 |
The Group is exposed to Chilean Peso (CLP) and British Pound Sterling (GBP) currency fluctuations.
The following table details the Group's sensitivity to a 10% increase and decrease in the Australian dollar against the relevant foreign currencies. 10% is the sensitivity rate used when reporting foreign currency risk internally to key management personnel and represent management's assessment of the possible change in foreign exchange rates. The sensitivity analysis includes only outstanding foreign currency denominated monetary items and adjusts their translation at the period end for a 10% change in foreign currency rates. The sensitivity analysis includes external loans as well as loans to foreign operations within the Group where the denomination of the loan is in a currency other than the currency of the lender or the borrower. A positive number indicates an increase in profit and equity where the Australian Dollar weakens against the respective currency. For a strengthening of the Australian Dollar against the respective currency there would be an equal and opposite impact on the profit and equity and the balances below would be negative.
|
10% Increase |
|
|
|
|
2025
|
2024
|
Profit/(loss) and equity - CLP |
7,947 |
7,781 |
Profit/(loss) and equity - GBP |
91 |
32,212 |
|
|
8,038 |
39,993 |
|
10% Decrease |
|
|
|
|
2025
|
2024
|
Profit/(loss) and equity - CLP |
(7,947) |
(7,781) |
Profit/(loss) and equity - GBP |
(91) |
(32,212) |
|
|
(8,038) |
(39,993) |
NOTE 18: PARENT ENTITY INFORMATION
The following details information related to the parent entity,
|
|
2025 $ |
2024 $ |
|
Current assets |
2,527,571 |
1,914,216 |
|
Non-current assets |
8,787,651 |
8,175,849 |
|
Total assets |
11,315,223 |
10,090,065 |
|
Current liabilities |
153,638 |
101,558 |
|
Non-current liabilities |
- |
- |
|
Total liabilities |
153,638 |
101,558 |
|
Net assets |
11,161,585 |
9,988,507 |
|
Issued capital |
38,821,620 |
35,964,396 |
|
Reserves |
4,370,174 |
4,230,962 |
|
Accumulated losses |
(32,030,210) |
(30,206,851) |
|
Total equity |
11,161,585 |
9,988,507 |
|
|
|
|
|
Loss of the parent entity |
(1,823,359) |
(1,325,224) |
|
Other comprehensive income for the year |
- |
- |
|
Total comprehensive loss of the parent entity |
(1,823,359) |
(1,325,224) |
(a) Guarantees
(b) Other commitments and contingencies
NOTE 19: CONTINGENT LIABILITIES
The Group has entered into the following royalty agreements:
· 2% net smelter return royalty in respect of the area covered by the tenements acquired from Zed Copper Pty Ltd vendors (or their nominee).
Other than outlined above, there are no contingent liabilities.
NOTE 20: COMMITMENTS
To maintain current contractual rights concerning its mineral projects, the Group has certain commitments to meet work program requirements but has no minimum expenditure requirements.
NOTE 21: DIVIDEND
No dividend was paid or declared by the Group in the period since the end of the financial year, and up to the date of this report. The Directors' do not recommend that any amount be paid by way of a dividend for the financial year ended 30 June 2025.
The balance of the franking account is Nil at 30 June 2025 (2024: Nil).
NOTE 22: SHARE BASED PAYMENTS
(a) Shares issued to suppliers:
During the year, 7,000,000 fully paid ordinary shares were issued to suppliers with a fair value of $96,000 in lieu of cash payment of invoices.
(b) Reconciliation to share based payments expense in profit or loss
|
|
2025 |
2024 |
Performance rights issued to directors and company secretary |
18,471 |
- |
|
|
18,471 |
- |
(c) Fair value of options and performance rights
The fair values of all options and performance rights issued in the current year and previous years have been determined using either the Black and Scholes model or the Trinomial model taking into account the inputs outlined in Note 11.
NOTE 23: ASSET ACQUISITION
The Group completed the acquisition 100% of the issued share capital of Audax Holdings Pty Ltd ("Audax") which holds an exclusive option to acquire an 85% interest in tenements comprising the assets in Harts Range, NT, on 28 October 2024 for a total purchase consideration on completion of:
· 145,500,000 fully paid ordinary shares in the Company
· $35,000 in cash for exclusivity fee to undertake site due diligence prior to acquisition
· $90,000 in cash for the reimbursement of costs and geological services previously expended by the vendors
Audax is not considered a business under AASB 3 Business Combinations; and the acquisition is accounted for as an acquisition of exploration assets. No other assets other than the interest in Harts Range, NT were owned by Audax at the date of acquisition.
Consideration paid
|
|
30 June 2025 |
|
|
$ |
Cash |
125,000 |
145,500,000 Ordinary Shares issued to the vendors |
1,309,500 |
8,730,000 Ordinary Shares issued to advisors in relation to the acquisition |
78,570 |
Allocated to exploration and evaluation assets |
1,513,070 |
NOTE 24: SUBSEQUENT EVENTS
In September 2025, the Board resolved to exit the Mkushi Project in
Other than as stated above, there were no known material significant events from the end of the financial year to the date of this report that have significantly affected, or may significantly affect the operations of the Group, the results of those operations, or the state of affairs of the Group in future financial periods.
CONSOLIDATED ENTITY DISCLOSURE STATEMENT
|
Entity name |
|
Entity type |
|
Place formed/ Country of incorporation |
|
Ownership interest % |
|
Tax residency |
|
|
|
|
|
|
|
|
|
|
|
Castillo Copper Chile SPA |
|
Body corporate |
|
|
|
100.00% |
|
|
|
Audax Holdings Pty Ltd |
|
Body corporate |
|
|
|
100.00% |
|
|
|
|
|
Body corporate |
|
|
|
100.00% |
|
|
|
Qld Commodities Pty Ltd |
|
Body corporate |
|
|
|
100.00% |
|
|
|
Total Iron Pty Ltd |
|
Body corporate |
|
|
|
100.00% |
|
|
|
Total Minerals Pty Ltd |
|
Body corporate |
|
|
|
100.00% |
|
|
|
BHA No. 1 Pty Ltd |
|
Body corporate |
|
|
|
100.00% |
|
|
|
Atlantica Holdings ( |
|
Body corporate |
|
|
|
100.00% |
|
|
|
Zed Copper Pty Ltd |
|
Body corporate |
|
|
|
100.00% |
|
|
|
Chalo Mining Group Ltd |
|
Body corporate |
|
|
|
100.00% |
|
|
as at 30 June 2025
Basis of Preparation
This consolidated entity disclosure statement (CEDS) has been prepared in accordance with the Corporations Act 2001 and includes information for each entity that was part of the consolidated entity as at the end of the financial year in accordance with AASB 10 Consolidated Financial Statements.
Determination of tax residency
Section 295 (3A) of the Corporation Act 2001 defines tax residency as having the meaning in the Income Tax Assessment Act 1997. The determination of tax residency involves judgement as there are currently several different interpretations that could be adopted, and which could give rise to a different conclusion on residency. In determining tax residency, the Group has applied the following interpretations:
Australian tax residency
The Group has applied current legislation and judicial precedent, including having regard to the Tax Commissioner's public guidance in Tax Ruling TR 2018/5.
Foreign tax residency
Where necessary, the Group has used independent tax advisers in foreign jurisdictions to assist in determining tax residency and ensure compliance with applicable foreign tax legislation.
Partnerships and Trusts
Australian tax law does not contain specific residency tests for partnerships and trusts. Generally, these entities are taxed on a flow-through basis, so there is no need for a general residence test. Some provisions treat trusts as residents for certain purposes, but this does not mean the trust itself is an entity that is subject to tax.
DIRECTORS' DECLARATION
In accordance with a resolution of the directors of
1. in the Directors' opinion, the financial statements and accompanying notes set out on pages 28 to 62 are in accordance with the Corporations Act 2001 and:
a. comply with Accounting Standards and the Corporations Regulations 2001, professional reporting requirements and all other mandatory requirements; and
b. give a true and fair view of the Group's financial position as at 30 June 2025 and of its performance for the year ended on that date;
2. in the Directors' opinion, the information disclosed in the consolidated entity disclosure statement on page 62 is true and correct;
3. in the Directors' opinion, there are reasonable grounds to believe that the Company will be able to pay its debts as and when they become due and payable; and
4. the Directors have been given the declarations by the Chief Executive Officer (or equivalent) and Chief Financial Officer (or equivalent) required by section 295A.
This declaration is made in accordance with a resolution of the Board of Directors and is signed for and on behalf of the Directors by:
Non-Executive Chairman
19th September 2025
ASX ADDITIONAL INFORMATION
Additional information required by the Australian Stock Exchange Ltd and not shown elsewhere in this report is as follows. The information is current at 03 September 2025.
Distribution of Share Holders
|
|
Ordinary Shares |
|
|
|
Number of Holders |
Number of Shares |
|
1 - 1,000 |
81 |
12,320 |
|
1,001 - 5,000 |
18 |
54,844 |
|
5,001 - 10,000 |
113 |
1,003,203 |
|
10,001 - 100,000 |
1,634 |
73,857,172 |
|
100,001 - and over |
1,306 |
1,530,285,086 |
|
TOTAL |
3,152 |
1,605,212,625 |
There were 1,049 holders of ordinary shares holding less than a marketable parcel, with total of 19,302,752 shares amounting to 1.20% of Issued Capital.
Quoted equity securities as at 03 September 2025
|
Equity Security |
Quoted |
|
Ordinary Shares |
1,605,212,625 |
Voting Rights
Each fully paid ordinary share carries the rights of one vote per share.
Unquoted Securities
There are no unquoted securities on issue at 03 September 2025:
Substantial Shareholders
There are no substantial shareholders.
Restricted Securities
There are no restricted securities.
Stock Exchange
The Company is listed on the Australian Securities Exchange and has been allocated the code "NFM". The "Home Exchange" is
The Company is also listed on the London Stock Exchange and has been allocated the code "NFM".
Other information
On-Market Buy-Back
There is currently no on-market buy-back in place.
Twenty largest holders of quoted securities as at 03 September 2025
|
Position |
|
No. of shares |
% |
|
1 |
|
135,550,078 |
8.44% |
|
2 |
MR <SOUTHLAND SNIPE SF A/C> |
88,000,000 |
5.48% |
|
3 |
ADAMANTIUM CORPORATE PTY LTD <DAS FAMILY A/C> |
80,833,333 |
5.04% |
|
4 |
|
29,527,342 |
1.84% |
|
5 |
WICKLOW CAPITAL PTY LTD <THE TIPPERARY A/C> |
25,000,000 |
1.56% |
|
6 |
TWW ASSETS PTY LTD <TWW ASSETS A/C> |
24,459,524 |
1.52% |
|
7 |
JBO ASSETS PTY LTD <JBO ASSETS A/C> |
24,259,525 |
1.51% |
|
8 |
TAKA CUSTODIANS PTY LTD <TAKA A/C> |
21,158,750 |
1.32% |
|
9 |
MR |
20,000,000 |
1.25% |
|
10 |
|
19,646,095 |
1.22% |
|
11 |
MR |
18,436,000 |
1.15% |
|
12 |
|
15,000,000 |
0.93% |
|
12 |
MR |
15,000,000 |
0.93% |
|
13 |
MRS |
13,166,667 |
0.82% |
|
14 |
MOUNT FALCON HOLDINGS PTY LTD <FALKINER FAMILY NO 2 A/C> |
13,085,000 |
0.82% |
|
15 |
EYEON NO 2 PTY LTD |
12,025,610 |
0.75% |
|
16 |
|
11,582,874 |
0.72% |
|
17 |
MR |
11,200,000 |
0.70% |
|
18 |
MR |
10,093,653 |
0.63% |
|
19 |
CELTIC CAPITAL PTE LTD <INVESTMENT 1 A/C> |
10,000,000 |
0.62% |
|
19 |
MR |
10,000,000 |
0.62% |
|
19 |
ANIMA FLUVIUS PTY LTD <SCIANO A/C> |
10,000,000 |
0.62% |
|
20 |
RPH CAPITAL INVESTMENTS PTY LTD |
9,527,981 |
0.59% |
|
|
Total |
627,552,432 |
39.09% |
TENEMENT INFORMATION AS REQUIRED BY LISTING RULE 5.3.3
|
|
||
|
|
||
|
Tenement ID |
Ownership at end of year |
Status |
|
EL34022 |
100% |
Granted |
|
EL32406 |
0% |
N/A* |
|
EL32513 |
0% |
N/A* |
|
EL34109 |
0% |
Under Application** |
|
EL34110 |
0% |
Under Application** |
*As announced on 21 October 2025, NFM has entered in to an earn-in agreement to acquire up to 85% interest in the tenements.
**These tenements are under applications which were made on 14 April 2025.
|
MT OXIDE |
||
|
Mt Isa region, northwest |
||
|
Tenement ID |
Ownership at end of year |
Status |
|
EPM 26513 |
100% |
Granted |
|
EPM 26525 |
100% |
Granted |
|
EPM 26574 |
100% |
Granted |
|
EPM 26462 |
100% |
Granted |
|
EPM27440 |
100% |
Granted |
|
|
||
|
|
||
|
Tenement ID |
Ownership at end of year |
Status |
|
24659-HQ-LEL |
100% |
Granted |
RNS may use your IP address to confirm compliance with the terms and conditions, to analyse how you engage with the information contained in this communication, and to share such analysis on an anonymised basis with others as part of our commercial services. For further information about how RNS and the London Stock Exchange use the personal data you provide us, please see our Privacy Policy.