
LEI: 213800B81BFJKWM2JV13
("ORIT" or the "Company")
Half-Year Results to
Disciplined capital allocation over H1 2025
Revenue well protected, with 85% fixed over next two years
Highlights
|
|
As at (unaudited)
|
As at (audited) |
|
NAV per Ordinary Share (p) |
99.5 |
102.6 |
|
Ordinary Share Price (p) |
73.4 |
68.0 |
|
Net asset value ("NAV") (£ million)
|
540 |
570 |
|
NAV total return since IPO on |
31.7 |
31.9 |
|
Gross asset value (£ million) |
1,010 |
1,029 |
|
|
H1 2025 |
H1 2024 |
|
Dividends declared per Ordinary Share (p) |
3.08 |
3.01 |
|
Dividend Cover |
1.19x |
1.33X |
|
Dividend Yield1 |
8.4% |
8.4% |
|
Generation (including compensation from curtailment) (GWh) |
654 |
658 |
|
Revenue (operational portfolio) (£m) |
68.7 |
68.7 |
|
EBITDA (operational portfolio) (£m) |
44.3 |
45.3 |
Financial Highlights
· NAV total return of -0.2% (H1 2024: +2.0%)
· NAV at
· 3.08p per Ordinary Share dividend declared over first half of 2025 - in-line with FY 2025 target of 6.17p
· Revenue well protected, with 85% fixed over the next two years; 47% inflation linked for next ten years
· Operational portfolio generated revenue of
Operational Highlights
Capital allocation strategy underway
· 12.3 million shares repurchased for a total consideration of
o A further
o Brings total repurchased since programme began to
· Several sales processes advanced; on track to realise the
· Selective investments continued, with follow-ons into Nordic Generation and BLC Energy and conditional acquisition of Irishtown
· Signed a new five-year term loan facility, enabling repayment of
· RCF term extended to
· Average cost of debt across the portfolio decreased to 3.5%, from 4.0% as at
· Above changes projected to save approximately
· On track to reduce debt to below 40% of GAV by year end
Operational Portfolio and Impact Highlights
· 654 GWh of clean electricity generated (H1 2024: 658 GWh)
· Solar portfolio output increased 34% compared with H1 2024
· Overall output broadly flat; strong solar performance offset by low winds
· 165K estimated equivalent tonnes of CO2 avoided in H1 2025 (H1 2024: 150K)
· 158K estimated equivalent homes powered by clean energy from ORIT's assets in H1 2025 (H1 2024: 147K)
Post Year End
· In
o The new fee will be based on an equal weighting of NAV and average market capitalisation and equates to an annualised saving of approximately
Announced Separately Today - ORIT 2030: A strategic roadmap for growth
ORIT 2030 is a defined five-year strategy designed to deliver substantial NAV growth, scale the company and generate attractive medium-to-long-term shareholder returns. The high-level strategic priorities for ORIT 2030 are summarised below. The Board has also recommended that the continuation vote moves to a cycle of every three years, from the current five years. Please see the separate stock market announcement for full details.
· Grow: Invest for NAV growth through disciplined deployment of capital into higher-return construction and developer opportunities
· Scale: Target
· Return: Target medium-to-long-term total returns of 9-11% through a combination of capital growth and income
· Impact: Scale with purpose and resilience adding new clean capacity and supporting the energy transition
"We believe the fundamental investment case for renewables remains compelling and we are optimistic about improving sector sentiment. ORIT is well-positioned in this context, with a portfolio diversified across geographies and technologies. With 85% of near-term revenues fixed or contracted, and a growing share inflation-linked, this provides resilience and visibility in a volatile environment. Looking ahead, the launch of our ORIT 2030 strategy provides a clear framework for growth, building on this strong foundation to deliver sustainable income and long-term capital
appreciation."
Interim Report and Accounts
To view the Company's Annual Report and Accounts please visit ORIT's website here:
https://www.octopusrenewablesinfrastructure.com/. The Interim Report and Accounts will also shortly be available on the National Storage Mechanism, which is situated at: https://data.fca.org.uk/#/nsm/nationalstoragemechanism.
Capital Markets Session and
An interim results update, alongside details of ORIT 2030, will be presented at today's in-person Capital Markets Session for sell-side analysts and institutional investors in
Additionally, there will be an online presentation via the
1 Dividend yield is calculated by dividing the target annual dividend per share of 6 .17p for FY 2025 and 6.02p for FY 2024 by the market share price as at
For further information please contact:
|
Octopus Energy Generation (Investment Manager)
|
Via orit@octopusenergygeneration.com
|
|
Peel
|
020 7418 8900 |
|
|
020 7466 5000 |
|
|
020 3327 9720 |
Notes to editors
About
Further details can be found at www.octopusrenewablesinfrastructure.com.
About Octopus Energy Generation
Octopus Energy Generation is driving the renewable energy agenda by building green power for the future. Its specialist renewable energy fund management team invests in renewable energy assets and broader projects helping the energy transition, across operational, construction and development stages. The team was set up in 2010 based on the belief that investors can play a vital role in accelerating the shift to a future powered by renewable energy. It has a 14-year track record with approximately
Further details can be found at www.octopusenergygeneration.com.
Chair's Statement
Philip Austin MBE
Chair,
Dear Shareholder,
On behalf of the Board, I am pleased to present the Interim Report for
Strategic focus and shareholder engagement
During H1 2025, a core focus for the Company has been disciplined capital allocation and improved operational performance. In March, the Board and Investment Manager set clear objectives for the remainder of the year: extending the share buyback programme to
We have also strengthened our dialogue with shareholders. Alongside several roadshows, meetings, and calls conducted by myself and the Investment Manager, the Board commissioned an independent perception audit to seek candid feedback from a broad base of investors. The results were encouraging - respondents expressed confidence in ORIT's investment team, our impact credentials, and the strength of the Octopus brand. Shareholders welcomed the clarity of our communications and reaffirmed support for the overall strategy. However, the findings also underscored the need for the Board to take more decisive action and to deliver on our objectives around gearing, capital recycling, and simplifying fee structures, as well as seeking ways to scale. All of these areas are a continued focus for the Board. In August we were pleased to announce a reduced management fee (effective
At our June AGM, we welcomed strong support for the continuation resolution, with 90.84% of votes in favour. I also note that a minority of shareholders voted against my re-election as Chair. The Board respects the views expressed and I have personally engaged with those shareholders to better understand their reasons. While the motivations were varied, we recognise that some shareholders are looking for faster, more visible action, and we are committed to responding constructively to that message. We are therefore pleased to launch our five-year strategic roadmap: ORIT 2030.
ORIT 2030
ORIT 2030 is a clear five-year strategy aimed at delivering substantial NAV growth, scaling the Company, and generating double-digit shareholder returns. The plan is built around four strategic priorities:
1. Grow: Invest for NAV growth through disciplined deployment of capital into higher-return construction and developer opportunities (see interim report for more detail)
2. Scale: Build a larger, more investable company with the ambition to grow to around
3. Return: Deliver sustainable risk-adjusted returns targeting 9-11% over the long term while maintaining progressive dividends and prudent balance sheet management
4. Impact: Scale with purpose and resilience adding new clean capacity and supporting the energy transition
Shareholders have been clear that they want ORIT to be larger, more investable, and to stay true to its purpose. ORIT 2030 is a decisive focus on growth, positioning the Company to deliver sustainable income alongside long-term capital appreciation. By recycling capital into new construction and developer opportunities, managing leverage with discipline, and drawing on the expertise of our Investment Manager, Octopus Energy Generation ("OEGEN"), we are setting a clear pathway to grow NAV, deliver resilient dividends, and create enduring value for shareholders.
OEGEN has a strong track record, having overseen the reconstruction of 496 MW of renewable capacity in the ORIT portfolio since inception and we are confident that this renewed focus will unlock greater growth potential for shareholders over the next five years. Our ambition is to scale ORIT into a larger and more investable company in the renewables sector, continuing to offer the market a differentiated proposition while also accelerating the energy transition. However, we recognise that to achieve meaningful scale, and to remain attractive to shareholders and new investors, we must look beyond organic growth. A key part of ORIT 2030 will be to identify potential M&A opportunities to achieve our ambitious growth targets.
More detail can be found in today's stock exchange announcement and will be provided at both our
Financial performance and dividends
NAV total return was broadly flat over the six-month period (-0.2%). The positive contribution from macroeconomic updates, including revised
We continued to deliver against our progressive dividend policy, paying 3.08p per Ordinary Share over the first half, in line with the full-year 2025 target of 6.17p per share. This target, increased by 2.5% from FY 2024 in line with
ORIT continues to offer shareholders an attractive income profile. Based on the FY 2025 dividend target of 6.17p, and the share price of 73.4p as at
Operational portfolio performance
The portfolio generated revenues of
Total clean electricity generation reached 654 GWh in H1 2025, broadly similar to the 658 GWh generated in H1 2024. While overall output was 7.9% below budget (primarily due to low winds and uncompensated grid curtailments), this represented an improvement from -11.3% in H1 2024, reflecting stronger operational availability and effective asset management actions across the portfolio. Notably, the solar portfolio ended the period with a 34% increase in output compared with H1 2024, demonstrating the value of technological diversification (see interim report for more detail).
Capital allocation and share buybacks
During the six months to
On the capital recycling front, discussions are advanced on several assets, progressing towards our
We have taken meaningful steps to reduce our borrowing costs and extend our debt maturity profile. As a result of actions taken in the first half of the financial year, the average cost of debt across the portfolio has fallen to 3.6% as at
While total leverage as a percentage of GAV increased slightly from 45% to 47%, largely as a result of the share buyback programme, we remain confident of reaching our objective of <40% by year end, supported by the portfolio sales.
Selective investments
Consistent with our strategy to reinvest selectively into potentially higher-return opportunities, ORIT committed an additional
In June we announced the conditional acquisition of Irishtown, a 32.6 MW solar site and the sixth project at the operational Ballymacarney complex that ORIT already owns. The acquisition is structured as a forward purchase agreement, with no capital outlay required until expected completion in H2 2026.
Impact and ESG progress
Impact remains central to ORIT's value proposition. In H1 2025, electricity generation from our assets led to the avoidance of approximately 165 kt of CO2 emissions. Our ongoing partnerships with Earth Energy Education and BizGive continue to deliver meaningful benefits, while our dedicated impact budget ensures that ORIT contributes far beyond financial returns. As part of this, we are excited to have collaborated with the
Governance and Board developments
We were pleased to welcome
Separately, an independent Board effectiveness review is now underway and expected to conclude in Q4 2025; this will help inform and enhance our future approach to governance and we will report the findings in the Annual Report and Accounts.
Investment management fees
On
Outlook
Looking ahead, the Board remains committed to delivering sustainable long-term value for shareholders and we are pleased to formally launch ORIT 2030. At its core, ORIT 2030 marks a return to the Company's original mandate of constructing new renewable energy assets to sit alongside a diversified portfolio of operational assets, thereby offering investors both capital appreciation and yield, while also supporting the energy transition.
Despite market headwinds, the fundamental investment case for renewables remains compelling and we are optimistic about improving sector sentiment, particularly as falling interest rates may help restore the relative appeal of income‑generating infrastructure offerings. ORIT is well-positioned in this context. Our portfolio is diversified across geographies, technologies, and revenue types, with 85% of near-term revenues fixed or contracted, and a growing share inflation-linked, providing resilience and visibility in a volatile environment. We are differentiated by our ability to combine stable, cash-generative assets with construction-stage and developer investments, creating upside potential while supporting the energy transition. In OEGEN, we have a best-in-class Investment Manager with deep sector expertise and a strong track record of origination, delivery, and portfolio management.
Through our strategic roadmap, ORIT 2030, we intend to unlock further value for shareholders by scaling the Company, continuing to recycle capital, and focusing on high-quality growth opportunities. With the strategic framework now set, supported by disciplined capital allocation, we are confident in ORIT's ability to deliver long-term value and to remain an attractive proposition for investors seeking sustainable returns with growth potential.
As always, we thank you for your continued support
Investment Manager's Report
Investment Manager: Octopus Energy Generation
Octopus Energy Generation ("OEGEN", trading name of
|
|
21 |
>4.9 GW |
>150 |
|
OEGEN AUM as at |
Invested in internationally1 |
Capacity managed |
Renewable energy professionals |
1 Assets under management defined as the sum of Gross Asset Value and capital committed to existing investments and signed (yet to be completed) deals and excludes capital available, yet to be deployed. Number of countries includes countries of assets under management, countries in which asset investments have been exited, countries of head offices of developer company investments, and countries of presence for OEGEN origination teams. Solar & wind construction is defined as total committed costs of assets either currently in construction or constructed under OEGEN management. Some of these assets are now operational within the portfolio.
Capital Allocation During H1 2025
Capital Allocation Objectives
Value-accretive investments
To be considered where it is believed they will support the Company's ability to deliver attractive returns
Realise at least
From asset sales by the end of this financial year to fund capital allocation initiatives
Announced in
<40% leverage target
Bring total gearing down to below 40% GAV by year end
Capital Allocation
|
Six months to |
Post year end |
|
|
(as at |
|
3 |
0 |
|
Investments/commitments made during the period |
New investments made post period |
|
Follow-on investments into developers BLC Energy and Norgen and conditional acquisition of 33 MW Irish solar site
|
|
|
|
|
|
Total allocated capital to new investments/commitments in the period |
Total allocated capital to new investments/commitments |
|
For the investments noted above
|
|
|
|
|
|
Shares repurchased (by value) |
Shares repurchased post period (by value)
|
|
47% leverage |
47% leverage |
|
As a % of GAV |
As a % of GAV |
|
( |
|
Company Developments During H1 2025
Portfolio Activity
|
February |
Norgen commitment |
|
|
Committed an additional |
|
March |
Follow-on investment into |
|
|
Made a follow-on investment of |
|
April |
Simply |
|
|
|
|
June |
Conditional acquisition of sixth Irish solar site |
|
|
Agreed to conditionally acquire a 32.6 MW Irish solar site for |
Impact highlights
FY 2025 Impact budget
Funding for local communities for specific projects1
1 Relates to the assets' community benefit funds, which are separate to the
Debt management
New term loan
Signed five-year facility on attractive terms with net proceeds used to reduce RCF
Total RCF Facility
RCF reduced from
3.6%
All-in borrowing cost
(
71%
% Hedged
(
Capital Recycling Programme
ORIT's capital recycling programme, launched in 2023 as part of a broader capital allocation strategy, has remained a central focus in the six months to
As part of a capital allocation update in
During the period, no asset sales had completed and leverage increased, largely due to borrowing for share buybacks. ORIT remains committed to selling strategically selected assets to support its capital allocation objectives. The Company has identified several portfolio assets the sales of which should enhance the future return profile of the Company, whilst also preserving the strong diversification. The proceeds from these sales will be used to buy back shares and pay down debt, driving value for shareholders. Several processes are well advanced and the Company remains on track to realise £80 million by the year end.
Share buybacks continued, and a total of £8.5 million was repurchased during the reporting period, adding 0.7 pence to NAV per share. Since the period end, to 15 September, a further £6.2 million shares were bought back, taking the further total gain on NAV per share, year to date, to 1.1 pence.
While the programme is still ongoing, the results of the capital recycling programme to date support the validity of ORIT's asset valuations, suggesting that the share price discount to NAV does not accurately reflect the Company's intrinsic value.
Post period: ORIT 2030
Building on this programme, the Company launched its five-year strategic roadmap, ORIT 2030, on 23 September 2025. The plan is built around four strategic priorities as highlighted in the Chair's statement (see interim report for more detail), with a core focus of investing for growth, funded by disciplined capital recycling in the near term. ORIT 2030 sets out a pathway to NAV growth by redeploying the proceeds from select assets into higher-return opportunities, in particular construction-stage projects (targeting ~20% of the portfolio over the next five years) and developer investments (~5%), which provide access to future pipelines. This strategy builds on OEGEN's proven track record in construction, and active investment approach.
Reinvestment will be weighed against other capital allocation tools, ensuring that proceeds are directed to where they can deliver the strongest combination of yield, growth and risk-adjusted returns. This includes prudent balance sheet management - reducing debt when while retaining flexibility to use leverage for value-accretive investments - and using share buybacks as a tool, subject to market conditions and capital availability. This disciplined approach is intended to grow the portfolio efficiently, increase dividends and maintain cover and allow financial flexibility to respond to opportunities as they arise.
Further details are provided in our London Stock Exchange announcement issued on 23 September 2025.
Construction track-record
496 MW
Constructed since inception
Figure 3: Assets invested into at construction stage and subsequently exited
|
Site name |
Technology |
Country |
Capacity (MW, pro-rata for ORIT ownership) |
Date of acquisition |
Date of exit |
IRR over lifetime of investment |
|
Ljungbyholm |
Onshore wind |
|
48 |
Mar-2020 |
Aug-2024 |
c.11% |
|
Krzecin |
Onshore wind |
|
19 |
Oct-2021 |
Dec-2023 |
c.30%
|
|
Kuslin |
Onshore wind |
|
40 |
Oct-2021 |
Dec-2023 |
Portfolio Breakdown
(30 June 2025)
|
|
|
|
Whole site |
|
|
Remaining |
|
|
|
|
|
|
capacity |
|
Start of |
asset life |
|
|
|
Technology |
Country |
Site name |
(MW) |
Phase |
operations |
(years) |
Stake % |
Key info |
|
Onshore wind |
|
Cumberhead |
50 |
Operational |
31/03/2023 |
27.8 |
100% |
Corporate PPA |
|
|
|
Crossdykes |
46 |
Operational |
30/06/2021 |
26.0 |
51% |
|
|
|
|
Cerisou |
24 |
Operational |
15/11/2022 |
27.3 |
100% |
French CfD |
|
|
|
Saunamaa |
34 |
Operational |
28/08/2021 |
26.3 |
100% |
Fixed pricing until end of 2025 |
|
|
|
Suolokangas |
38 |
Operational |
29/12/2021 |
26.5 |
100% |
|
|
|
|
Leeskow |
35 |
Operational |
30/09/2022 |
27.3 |
100% |
German CfD |
|
Offshore wind |
|
|
270 |
Operational |
31/10/2013 |
23.3 |
15.5% |
ROC Subsidised |
|
|
|
Penhale |
4 |
Operational |
18/03/2013 |
27.7 |
100% |
|
|
Solar |
|
Wilburton 2 (Mingay) |
19 |
Operational |
19/03/2014 |
18.7 |
100% |
ROC Subsidised |
|
|
|
Abbots Ripton |
25 |
Operational |
28/03/2014 |
28.8 |
100% |
|
|
|
|
Ermine Street |
32 |
Operational |
29/07/2014 |
19.1 |
100% |
|
|
|
|
Ottringham |
6 |
Operational |
07/08/2014 |
29.1 |
100% |
|
|
|
|
|
11 |
Operational |
10/03/2015 |
24.7 |
100% |
|
|
|
|
Westerfield |
13 |
Operational |
25/03/2015 |
19.7 |
100% |
|
|
|
|
Chisbon |
12 |
Operational |
03/05/2015 |
25.2 |
100% |
|
|
|
|
Breach |
67 |
Operational |
25/06/2024 |
39.0 |
100% |
Corporate PPA |
|
|
|
Charleval |
6 |
Operational |
26/03/2013 |
27.7 |
100% |
French FiT |
|
|
|
Cuges |
7 |
Operational |
17/04/2013 |
27.8 |
100% |
|
|
|
|
Istres |
8 |
Operational |
18/06/2013 |
28.0 |
100% |
|
|
|
|
La Verdière |
6 |
Operational |
27/06/2013 |
28.0 |
100% |
|
|
|
|
Brignoles |
5 |
Operational |
26/06/2013 |
28.0 |
100% |
|
|
|
|
Saint |
8 |
Operational |
28/11/2013 |
28.4 |
100% |
|
|
|
|
Chalmoux |
10 |
Operational |
01/08/2013 |
28.1 |
100% |
|
|
|
|
lovi 1 |
6 |
Operational |
17/07/2014 |
29.0 |
100% |
|
|
|
|
lovi 3 |
6 |
Operational |
17/07/2014 |
29.0 |
100% |
|
|
|
|
Fontienne |
10 |
Operational |
02/07/2015 |
30.0 |
100% |
|
|
|
|
Ollieres 1 |
12 |
Operational |
19/03/2015 |
29.7 |
100% |
|
|
|
|
Ollieres 2 |
11 |
Operational |
19/03/2015 |
29.7 |
100% |
|
|
|
|
Arsac 2 |
12 |
Operational |
05/03/2015 |
17.7 |
100% |
|
|
|
|
Arsac 5 |
12 |
Operational |
30/01/2015 |
16.6 |
100% |
|
|
|
|
Ballymacarney1 |
54 |
Operational |
18/12/2023 |
38.5 |
100% |
Corporate PPA |
|
|
|
Fidorfe1 |
68 |
Operational |
18/12/2023 |
38.5 |
100% |
|
|
|
|
Muckerstown1 |
48 |
Operational |
18/12/2023 |
38.5 |
100% |
|
|
|
|
Kilsallaghan1 |
29 |
Operational |
18/12/2023 |
38.5 |
100% |
|
|
|
|
Harlockstown1 |
42 |
Operational |
23/09/2024 |
39.5 |
100% |
|
|
|
|
Irishtown1 |
33 |
Conditional acquisition |
- |
- |
- |
Completion expected H2 2026 |
|
Developer |
|
Wind 2 |
- |
Developer |
- |
- |
25% |
Onshore wind |
|
|
|
HYRO |
- |
Developer |
- |
- |
25% |
Green hydrogen |
|
|
|
Simply Blue |
- |
Developer |
- |
- |
19% |
Floating offshore wind / E-fuels |
|
|
|
Norgen |
- |
Developer |
- |
- |
30% |
Onshore wind/solar |
|
|
|
BLCe serviced platform |
- |
Developer |
- |
- |
100% |
Solar/co-located battery storage |
1 The first five sites listed in
Weighted average remaining asset life by capacity (years)
|
Technology |
Weighted average remaining asset life (years) |
|
Onshore wind |
26.9 |
|
Offshore wind |
23.3 |
|
Solar |
32.3 |
|
Total |
31.2 |
|
551 MW |
203 MW |
42 MW |
|
Across 28 solar plants1 |
Across six onshore wind farms |
Across one offshore wind farm |
|
5 |
85% |
47% |
|
Investments in developers |
Fixed revenue for the next two years (up to 30 June 2027) |
Inflation-linked revenue for the next ten years (up to 30 June 2035) |
1 Excludes Irishtown which is a conditional acquisition.
£1,026m
Total value of all investments
Portfolio composition broken down by total value of all investments in accordance with the Company's investment policy (including the amount committed to the conditional acquisition of Irishtown). The investments are valued on an unlevered basis and including amounts committed but not yet incurred. Totals may not add up due to rounding.
Country
Developer: 4%
Technology
Solar: 48%
Onshore wind: 35%
Offshore wind: 13%
Developer: 4%
Asset phase
Operational: 96%
Developer: 4%
797 MW
Capacity owned1
Portfolio composition broken down by MW of capacity pro rata for ORIT's ownership on a current invested basis.
Country
Technology
Solar: 69%
Onshore wind: 26%
Offshore wind: 13%
Asset phase
Operational: 100%
1 Excludes Irishtown, the sixth site within the Ballymacarney solar complex in
£1,026m
Total value of all investments
Portfolio composition broken down by offtaker and O&M providers as a percentage of total value of all investments1
Offtaker
Microsoft: 21%
EDF: 17%
British Gas: 13%
Esti Energi: 12%
Npower/Axpo: 7%
Alpix: 6%
Iceland Foods: 5%
N/a: 4%
Sky Media: 4%
Having multiple offtakers offers advantages such as risk diversification and offers local expertise in ORIT's key geographical markets.
O&M provider
Statkraft: 21%
Orsted: 13%
Vestas: 12%
Engie: 11%
PSH: 6%
RES: 5%
SGRE: 5%
Goldbeck: 5%
N/a: 4%
BayWa: 1%
A diversified group of O&M providers allows ORIT to leverage competitive pricing and specialised expertise.
1 Npower/Axpo: Sites sell ROCs and power to NPower but also have a price-fixing arrangement with Axpo.
Portfolio Performance
Operational portfolio technical and financial performance
|
|
H1 2025 Actuals |
H1 2025 Variance |
|
Technology |
(MWh) |
against the budget |
|
Solar |
293,932 |
-0.4% |
|
Onshore wind |
291,308 |
-14.6% |
|
Offshore wind |
68,301 |
-7.2% |
|
Total |
653,541 |
-7.9% |
In the six months to 30 June 2025, ORIT's portfolio generated 654 GWh of clean electricity compared with 658 GWh1 for the same period the previous year. While overall output was broadly flat, low winds and grid curtailments were behind the 8% shortfall in the compensated generation versus budget across the ORIT portfolio in H1 2025. By comparison, H1 2024 ended with -11% generation variance. This year-on-year improvement reflects the higher operational availability as well as the effectiveness of asset management actions over the period.
Over the six months to 30 June, revenues of £68.7 million were achieved, flat versus the same period last year, and 6% below budget. Operating expenditure ("Opex") increased compared with the same period last year, primarily due to the growth in installed capacity. Opex savings compared with budget are largely due to timing differences. The resulting EBITDA across the operating portfolio totalled £44.3 million, 7% below budget.
Figure 4: Performance of the Company's underlying operational investments
|
|
Output1 |
Revenue |
Opex |
EBITDA |
|
Operational portfolio |
654 GWh |
£68.7m |
£24.4m |
£44.3m |
|
|
-1% vs 2024 |
0% vs 2024 |
+4% vs 2024 |
-2% vs 2024 |
|
|
-8% vs budget |
-6% vs budget |
4% favourable to budget |
-7% vs budget |
|
|
(H1 2024: 658 GWh) |
(H1 2024: £68.7m) |
(H1 2024: £23.4m) |
(H1 2024: £45.3m) |
|
Solar |
294 GWh |
£33.1m |
£7.8m |
£25.3m |
|
|
+34% vs 2024 |
+32% vs 2024 |
+20% vs 2024 |
+37% vs 2024 |
|
|
0% vs budget |
+3% vs budget |
1% favourable to budget |
+4% vs budget |
|
|
(H1 2024: 220 GWh) |
(H1 2024: £25.0m) |
(H1 2024: £6.5m) |
(H1 2024: £18.5m) |
|
Onshore wind |
291 GWh |
£16.7m |
£4.8m |
£11.9m |
|
|
-18% vs 2024 |
-26% vs 2024 |
-9% vs 2024 |
-32% vs 2024 |
|
|
-15% vs budget |
-17% vs budget |
13% favourable to budget |
-18% vs budget |
|
|
(H1 2024: 354 GWh) |
(H1 2024: £22.7m) |
(H1 2024: £5.3m) |
(H1 2024: £17.4m) |
|
Offshore wind |
68 GWh |
£18.9m |
£11.8m |
£7.1m |
|
|
-19% vs 2024 |
-10% vs 2024 |
+2% vs 2024 |
-24% vs 2024 |
|
|
-7% vs budget |
-10% vs budget |
2% favourable to budget |
-19% vs budget |
|
|
(H1 2024: 84 GWh) |
(H1 2024: £21.0m) |
(H1 2024: £11.6m) |
(H1 2024: £9.4m) |
Note: Totals may not add up due to rounding.
1 Generation quoted is post-compensation (actual output + compensation for equivalent lost production ORIT is entitled to under curtailment and/or contractual mechanisms). H1 2024 generation figures differ from the published figures in the June 2024 Interim Report as they have been restated to include compensated generation from curtailment, making for a like-for-like comparison with the H1 2025 figures.
Solar
ORIT's solar portfolio ended H1 2025 in line with budget and a 34% increase in output compared with the same period the prior year1. The
Grid curtailment and several technical issues offset much of the uplift from irradiance, with curtailments on the Irish grid exceeding 30 GWh. Currently around 5 GWh of the lost generation from curtailments in
Another loss event was the shutdown of the 7.3 MW Cuges site in
Losses categorised under "Other" comprise a series of smaller downtime events. Among them, the most material was underperformance at two French solar sites (24 MW combined) due to lichen growth on panel surfaces.
A tailored solution is being deployed in October, with performance recovery expected in Q4 2025.
Our
1 H1 2024 generation figures differ from the published figures in the June 2024 Interim Report as they have been restated to include compensated generation from curtailment, making for a like-for-like comparison with the H1 2025 figures.
Revenues and EBITDA:
Over the six-month period, the solar portfolio generated revenues of £33.1 million, +3% versus budget of £32.2 million, and 32% more than the same period the prior year1. Although generation was slightly below budget, revenues exceeded expectations, driven by higher constraint payments in the Irish portfolio and the successful negotiation of a fixed PPA for one of the
Operating expenditure amounted to £7.8 million, largely in line with budget (£7.9 million), but a 20% increase over 2024. The resulting EBITDA was £25.3 million, +4% versus budget (£24.3 million), as a consequence of the higher revenues achieved.
H1 2025 solar output variance to budget (GWh) (see figure 5 in the Interim Report for more detail)
Onshore wind
Production:
The onshore wind portfolio underperformed against budget, mainly due to low winds (15% below expectations). Economic curtailments, relating mainly to the Balancing Mechanism and negative pricing periods, limited export but were compensated adding to the overall output. There are no unresolved technical issues affecting the onshore wind portfolio.
Generation in absolute terms was down versus the same period last year, largely due to the sale of Ljungbyholm wind farm in the second half of 2024. Despite fewer assets, year-on-year performance of the onshore wind portfolio improved on weather-adjusted figures by 3%, which demonstrates recovery from the technical issues that affected performance in FY 2024. In
Revenues and EBITDA:
The onshore wind portfolio delivered total revenues of £16.7 million for the six-month period, -17% vs budget (£20.1 million), and 26% less than the same period last year given we have fewer turbines than in H1 2024. The budget variance was primarily driven by lower-than-expected generation, and weaker power prices in
Operational expenditure totalled £4.8 million, 13% favourable to budget (£5.5 million). The resulting EBITDA was £11.9 million, -18% vs budget (£14.6 million), due to the lower than anticipated revenues.
H1 2025 onshore wind output variance to budget (GWh) (see figure 6 in the Interim Report for more detail)
Offshore wind
Production:
Low winds were the main reason for underperformance of the offshore wind portfolio. Adjusting for the impact of weather, exported generation was around 1% below budget. The remaining generation losses were mainly a result of gearboxes and generator replacements being required on more turbines than budgeted for in the period. Replacement of these major components on all turbines at
Revenues and EBITDA:
Operational expenditure totalled £11.8 million, 2% lower than budgeted (£12.1 million). This resulted in EBITDA of £7.1 million, -19% vs budget (-£1.7 million).
H1 2025 offshore wind output variance to budget (GWh) (see figure 7 in the Interim Report for more detail)
Asset management
Octopus Energy Generation actively manages ORIT's assets and follows a proactive approach of identifying and mitigating risks to secure the long-term performance of its growing and diverse global portfolio of renewable energy assets.
Case study
Penhale - Proactive risk management and swift recovery
In late May 2025 one of ORIT's
Construction and development portfolio
ORIT classifies itself as an impact fund with a core objective to accelerate the transition to net zero through its investments in building and operating a diversified portfolio of renewable energy assets. Central to ORIT's strategy is the principle of additionality - actively increasing renewable energy capacity. By investing in construction assets and developer companies, ORIT not only supports existing infrastructure but also expands the sector's capacity. This ensures ORIT's investors directly contribute to new renewable energy projects, driving the energy landscape towards net zero.
Construction portfolio
Investing in construction projects creates new renewable capacity and offers the potential for enhanced returns through a construction premium as projects are completed.
During the period there was no construction activity, but ORIT made a conditional acquisition of a sixth solar site, Irishtown, at the Ballymacarney solar complex (see interim report for more detail). ORIT will complete the purchase after the project has completed operational testing, which is expected in the second half of 2026.
Developer portfolio
Investing in developers offers the potential for higher returns than operating assets, while providing preferential access to construction-ready projects
|
Simply Blue Group
Nova Sustainable Fuels |
· 19% stake · Floating offshore wind / e-Fuels · |
During the period, progress was made on discussions with potential long-term strategic partners for the floating offshore wind business, and the restructuring of the e-fuels platform (Nova) was completed. Post-period the 100 MW Salamander project in Scottish waters received planning consent, and secured a new 80% funding partner. |
|
||
|
Wind2 |
· 25% stake · Onshore wind · |
The nine-project pipeline totals ~1 GW. Several planning submissions were made in H1 2025, with further progress expected later this year. The first projects are targeted to reach RTB from 2026 onwards, subject to land and grid negotiations. |
|
||
|
BLC Energy |
· 100% stake · Solar and BESS · |
BLC has grown its pipeline to ~0.7 GW. ORIT committed an additional £1.5 million during the period to accelerate advanced projects. These are expected to be among the first to benefit from the |
|
||
|
Nordic Generation |
· 30% stake · Solar and onshore wind ·
|
The partnership, with a pipeline of ~0.8 GW, was restructured in early 2025 to give ORIT a stake in the development team along with the underlying pipeline. Development progressed in line with expectations, with the most advanced project targeting RTB in early 2026. |
|
||
|
HYRO |
· 25% stake · Green hydrogen · |
HYRO advanced its flagship Northfleet hydrogen project through key milestones in H1 2025. |
|
||
|
5 |
10 GW |
2026 |
|||
|
Developer investments |
Combined pipeline of renewable projects |
First project expected to reach Ready-to-Build ("RTB") |
|||
Breakdown of pipeline capacity by stage (GW) (See Figure 8 in the Interim Report for more detail)
Expected capacity reaching Ready-to-Build (See Figure 9 in the Interim Report for more detail)
Our c.10 GW development pipeline spans all stages. While most capacity is at early stages, we expect a material tranche to reach RTB from 2026 onwards, providing preferential access to new operating assets.
Market Outlook
Macroeconomic environment
In the
In the
Although these modest downward moves in rates and yields have marginally improved the macroeconomic backdrop for listed infrastructure funds, a more substantial and sustained decline in both base rates and long-end yields will likely be needed to trigger a broader re-rating across the sector.
Renewables market outlook
In H1 2025, the
In July 2025, the government confirmed that it would not pursue zonal or locational pricing under the Review of Electricity Market Arrangements (REMA).1 While the wider REMA programme remains ongoing, with potential reforms expected in areas such as transmission charging, the decision to retain a national pricing structure removes a key source of uncertainty in the market.
Internationally, Q1 and Q2 2025 saw
Across
Investment trust landscape
While the second quarter of 2025 saw a modest recovery in share prices,
A notable shift during the period has been the acceleration of M&A activity across the sector. Key transactions include the sale of
Shareholder activism remains a prominent theme. While a US hedge fund was unsuccessful in its efforts to drive board changes across several
Another headwind to the broader sector has been a rise in popularity of lower-cost exchange-traded funds, which are potentially drawing capital away from investment trusts.
Commentary on power prices can be found in the Investment Manager's section (see interim report for more detail).
1 https://www.gov.uk/government/publications/review-of-electricity-market-arrangements-rema-summer-update-2025
2 https://ec.europa.eu/commission/presscorner/detail/en/ip_25_550
3 https://www.solarpowerportal.co.uk/brookfield-acquires-atrato-onsite-energy-in-220-million-deal/
4 https://www.solarpowerportal.co.uk/foresight-buys-harmony-energy-income-trust-takes-fund-private/
5 https://citywire.com/wealth-manager/news/end-of-round-one-as-seventh-trust-sees-off-saba/a2459809
Financing
ORIT continues to actively manage its capital structure in line with its disciplined approach to capital allocation. The Group's debt structure consists of three key components:
1. RCF: A short term, flexible revolving credit facility held by the Company's immediate 100% subsidiary
2.
3. Project Term Loans: Long-term amortising debt facilities secured at the individual asset level
During the first half of 2025, ORIT resized and extended the maturity of its RCF, enhancing near-term flexibility while reducing the total committed facility size to £150 million (from £270.8 million) to reflect expected funding needs. In parallel, £98.5 million of drawn balance from the RCF was repaid using the new
As at 30 June 2025, the Company's gearing had temporarily increased to 47% from 45%, primarily due to the ongoing share buyback programme. Nonetheless, the Investment Manager remains focused on reducing short-term debt where appropriate. Proceeds from targeted asset sales in the second half of the year are expected to support further deleveraging. The Company remains on track to reduce total gearing to below 40% by the end of 2025 - a level the Board considers sustainable over the long term. While temporary fluctuations above this target may occur, ORIT does not expect to remain above this level for an extended period.
ORIT debt summary as at 30 June 2025:
|
|
Total Debt |
RCF |
|
Project |
|
Debt as a % of GAV |
47% |
7% |
10% |
30% |
|
% Hedged |
71% |
0% |
75% |
85% |
|
Average cost of debt |
3.6% |
6.0% |
5.3% |
2.5% |
|
Average remaining term (years) |
10.3 |
2.7 |
4.8 |
13.9 |
Summary of ORIT debt facilities as at 30 June 2025:
|
|
|
|
Project Term Loans |
||||
|
|
|
|
|
|
|
|
|
|
Asset |
RCF |
Facility |
FR Solar |
FR Wind |
IRE Solar |
GER Wind |
Wind |
|
Debt Terms |
|
|
|
|
|
|
|
|
Currency |
GBP or EUR |
GBP |
EUR |
EUR |
EUR |
EUR |
GBP |
|
Drawn at 30 June 2025 £m |
£68.0m |
£100.0m |
£72.4m |
£36.2m |
£82.9m |
£44.8m |
£63.5m |
|
Initial Term (years) |
3 |
5 |
18 |
20 |
20 |
18 |
15 |
|
Expiry Date |
Jun-28 |
Mar-30 |
Dec-38 |
Sep-42 |
Dec-42 |
Mar-41 |
Sep-32 |
|
Facility date |
Nov-20 |
Mar-25 |
Jan-21 |
Apr-21 |
Jul-21 |
Sep-22 |
Dec-17 |
|
Margin |
2.0% |
1.35% |
1.25% |
1.30% |
2024-2029 |
0.83%-1.75% |
2017-2022: |
|
Variable interest % |
SONIA |
SONIA |
EURIBOR |
EURIBOR |
EURIBOR |
EURIBOR |
SONIA |
|
Hedging |
|
|
|
|
|
|
|
|
% hedged |
- |
75% |
85% |
90% |
75% |
100% |
85% |
|
Swap rate |
n/a |
3.90% |
-0.12% |
0.51% |
3.30% |
0.12% |
1.27% |
Portfolio Valuation
|
£540m |
99.5p |
£1,010m |
£1,026m |
|
Net Asset Value (31 December 2024: £570m) |
NAV per Ordinary Share (31 December 2024: |
Gross Asset Value (31 December 2024: |
Total value of all investments |
|
(31 December 2024: |
In calculating the Company's NAV, quarterly valuations are undertaken for the Company's underlying portfolio of assets. The process follows International Private Equity Valuation Guidelines using a discounted cashflow ("DCF") methodology for operational assets. DCF is deemed the most appropriate methodology where a detailed projection of likely future cash flows is possible. Due to the asset class, availability of market data and the ability to project the asset's performance over the forecast horizon, a DCF valuation is typically the basis upon which renewable assets are traded in the market.
Investments into developers and development-stage projects are held at cost or the price of recent investment, with adjustments for material changes such as milestone outcomes, further investment rounds, or other developments that reflect progress or risk.
Key macroeconomic and fiscal assumptions for the valuations are set out in Note 7 of the financial statements.
Including the Company's and its intermediate holding companies' net liabilities (which mostly comprises Holding Company debt and cash), the total NAV as at 30 June 2025 is £540.4 million or 99.5 pence per Ordinary Share.
The key valuation drivers are shown below:
Plc NAV Bridge
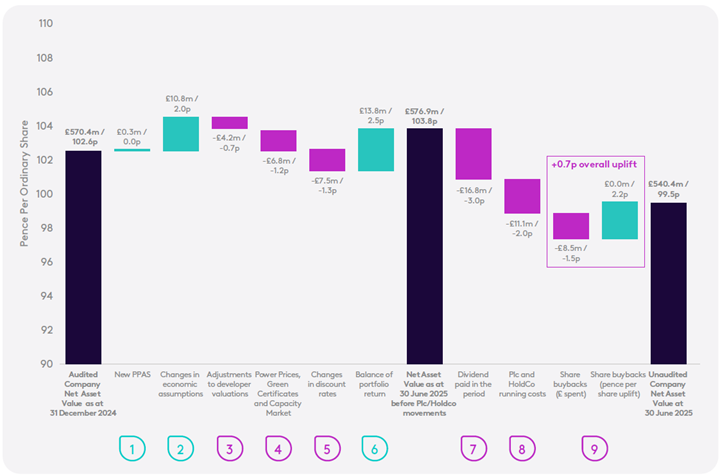
Movements in the fair value of the underlying portfolio of assets
1 New PPAs
(+0.0 pence per Ordinary Share)
A small uplift was recognised from newly contracted power purchase agreements. While immaterial in the context of the overall NAV, this reflects continued progress in revenue certainty across the portfolio.
2 Changes in economic assumptions
(+2.0 pence per Ordinary Share)
Macroeconomic updates contributed positively to NAV across the period. The principal drivers were:
- An upward revision to the
- A planned reduction in
- Foreign exchange movements, primarily the weakening of sterling against the euro, also contributed positively in the period, though partially offset by the Company's currency hedging.
Together, these factors supported portfolio valuations resulting in a valuation uplift of 2.0 pence per Ordinary Share.
3 Adjustments to Developer Valuations (-0.7 pence per Ordinary Share)
Valuations of early-stage investments were adjusted to reflect prevailing conditions. In Q2 2025, the fair value of ORIT's investment in Simply Blue Group ("SBG") was reduced, driven by headwinds in the floating offshore wind sector and the anticipated outcome of funding discussions for Simply Blue's project pipeline. This was partially offset by a valuation gain following the successful restructuring of the Norgen investment, announced in February 2025. These adjustments resulted in a net reduction in the portfolio valuation of development-stage assets of approximately 0.7 pence per Ordinary Share.
Despite these adjustments, ORIT continues to see long-term value in its development exposure. The broader development pipeline continues to mature, with the first projects expected to become construction-ready in 2026.
4 Power Prices, Green Certificates and Capacity Market
(-1.2 pence per Ordinary Share)
Movements in power prices and green certificate forecasts resulted in a net negative impact on valuations during the first half of the year.
Most of the reduction was driven by updated forward pricing curves, which now incorporate an additional year of lower-priced market forwards compared with the year-end valuations. The annual extension is a standard part of ORIT's valuation methodology, ensuring that near-term pricing reflects transparent, market-observable data. Forward prices are applied to the first few years as they represent the most objective indicator of current market expectations; beyond this, the valuation transitions to long-term forecasts, which are used where forward markets become less liquid or representable.
Of the overall power price movement, approximately 75% related to changes in forward prices - with over half of that impact attributable to the roll-forward of an additional pricing year. The remainder reflects declines in medium‑ to long‑term power price forecasts across most of ORIT's core markets.
Despite these headwinds, ORIT's portfolio remains highly protected against short-term volatility. As at 30 June 2025, 85% of forecast revenues over the next 24 months were fixed or contracted. This level of contracted cash flow offers a high degree of visibility and stability in returns.
The decline in power prices was partially offset by revised upward forecasts for medium-to long-term Capacity Market and Green Certificate values, including Renewable Energy Guarantees of Origin ("REGOs") and Guarantees of Origin.
5 Changes in discount rates
(-1.3 pence per Ordinary Share)
During the period, the weighted average discount rate applied to the portfolio valuations increased, reflecting a continued high interest environment and the impact of new project-level financing. This adjustment aligned the Company's valuation inputs with broader market benchmarks and was supported by transaction evidence observed by the Investment Manager (see interim report for more detail).
6 Balance of portfolio return
(+2.5 pence per Ordinary Share)
This refers to the balance of portfolio valuation movements in the period excluding the factors noted above and represents a net increase of 2.5 pence per Ordinary Share.
It reflects a 4.5 pence per Ordinary Share uplift from the net present value of future cashflows being brought forward from 31 December 2024 to 30 June 2025, which was partially offset by lower-than-expected cash generation, principally due to low wind speeds, and a refresh of Capex and Opex assumptions at some sites.
Movements in the fair value of the Plc and Holding Companies
7 Dividends paid in the period
Dividends totalling £16.8 million in respect of Q4 2024 and Q1 2025 were paid during the 6-month period to 30 June 2025.
8 Plc and Holding Company running costs
Running costs of the plc and Holding Companies totalling £11.1 million were paid during the period, mostly comprising RCF interest and financing costs, management fees and general running costs.
9 Share buybacks
During the period, £8.5 million has been spent on the repurchase of Ordinary Shares at a discount to NAV, which has resulted in an increase in NAV per Ordinary Share of +0.7 pence.
Key Valuation Assumptions
See below a summary of the key inputs that drive ORIT's portfolio value
|
|
Long-term inflation |
Taxation |
|
|
2.25%1 |
25.0% |
|
|
2.00% |
25.0% |
|
|
2.00% |
12.5% |
|
|
2.00% |
18.0%2 |
|
|
2.00% |
15.8% |
Power price forecasts
Where not fixed under PPAs or hedged, we use forward market prices in the near term before transitioning to a blend of two independent consultants' long-term forecasts. Capture prices are updated regularly to reflect cannibalisation effects. For solar, we apply generic country-level capture prices, while for wind we reflect site-specific curves to account for greater variation in output and pricing.
Asset lives and decommissioning
Operational lives are assessed on an asset-by-asset basis, taking into account lease terms, planning consents, extension rights and technical performance. We also include decommissioning and land restoration costs as end-of-life outflows, ensuring valuations capture the full lifecycle economics of each project.
1
2 Valuation movement reflects a planned reduction in
Discount Rates
A range of discount rates are applied in calculating the fair value of the investments, reflecting factors such as the location, technology and lifecycle stage of each asset as well as capital structure and the split of fixed and variable revenues.
The high interest rate environment persisted into the first half of 2025, with bond yields remaining elevated across ORIT's core markets. While inflation has shown signs of stabilisation, central banks have maintained relatively tight monetary policy conditions. These macroeconomic factors continue to influence discount rate benchmarks for infrastructure and renewable assets.
During the period, the weighted average discount rate ("WADR") implied by ORIT's portfolio valuations increased to 7.9% (7.5% on a basis excluding the benefit of FX hedging) at 30 June 2025, compared with 7.4% (7.0%) as at 31 December 2024. This uplift reflects alignment with prevailing market conditions and was supported by transaction evidence observed by the Investment Manager. In addition to external market movements, the completion of new project-level financing (the
The Investment Manager will continue to actively monitor market transactions, movements in risk-free rates, and sector benchmarks to ensure that the discount rate assumptions remain appropriately calibrated within each quarterly valuation.
|
|
30-Jun-25 |
31-Dec-24 |
|
|
|
|
|
Levered IRR (GBP) |
8.4% |
7.6% |
|
Gross Asset Value (GAV) (£m) |
467 |
460 |
|
Asset Leverage %GAV |
35% |
16% |
|
European Assets |
|
|
|
Levered IRR (GBP) |
7.5% |
7.2% |
|
Levered IRR (EUR) |
6.9% |
6.6% |
|
Gross Asset Value (GAV) (£m) |
544 |
569 |
|
Asset Leverage %GAV |
43% |
42% |
|
Total Portfolio |
|
|
|
Levered IRR (GBP) |
7.9% |
7.4% |
|
Levered IRR (local currency) |
7.5% |
7.0% |
|
Gross Asset Value (GAV) (£m) |
1,010 |
1,029 |
|
Total Leverage %GAV |
47% |
45% |
The WADR does not include any contribution from the following, each of which is expected to enhance the returns ultimately delivered to shareholders:
- The return expected on the Company's development stage assets, which are not valued on a discounted cash flow basis; and
- The return associated with additional leverage from the Company RCF.
|
Weighted average discount rate as at 30 June 2025 |
7.9% |
|
|
(i) |
Return expected on the Company's investments into development stage assets |
+0.3% |
|
(ii) |
Increase in return associated with the additional leverage from the RCF |
+0.1% |
|
Adjusted average discount rate as at 30 June 2025 |
8.2% |
|
Total may not sum due to rounding
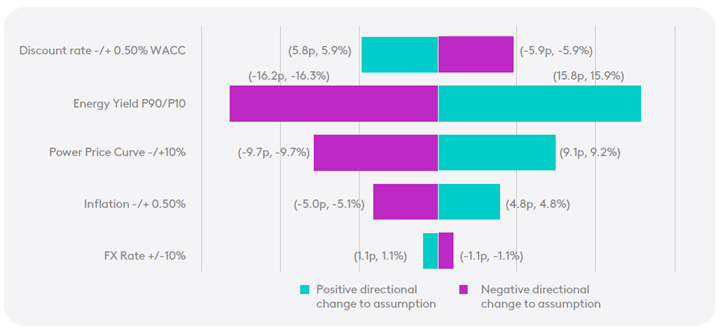
Portfolio Valuation Sensitivities
As part of ongoing valuation monitoring, the Investment Manager continues to assess the impact of changes in key assumptions on NAV per share. These sensitivities are based on the portfolio as at 30 June 2025, including committed acquisitions, and assume changes occur independently.
They are not additive and do not reflect any diversification benefits across the portfolio.
1. Discount rate (levered cost of equity)
A range of discount rates is applied in the valuation of investments, reflecting the specific location, technology, revenue structure and gearing.
While this is not the most material driver of NAV, this sensitivity remains an important indicator of how external market shifts, particularly in the cost of capital, could affect valuations.
2. Volumes (Energy Yield P90/P10)
Yield assumptions are derived from independent P50 assessments for each asset, with P90 and P10 scenarios used to illustrate variability in long-term output.
This is the most material NAV sensitivity, reflecting the importance of production performance to asset value. The Company continues to prioritise robust yield analysis and diversification to manage this exposure effectively.
The P50 output is the estimated annual amount of electricity generation that has a 50% probability of being exceeded - both in any single year and over the long-term - and a 50% probability of being underachieved. The P50 provides an expected level of generation over the long term. The P90 (90% probability of exceedance over a 10-year period) and P10 (10% probability of exceedance over a 10-year period) sensitivities reflect the future variability of wind speed and solar irradiation and the associated impact on output, along with the uncertainty associated with the long-term data sources used to calculate the P50 forecast. The sensitivities shown assume that the output of each asset in the portfolio is in line with the P10 or P90 output forecast respectively for each year of the asset life.
3. Power price curve
The power price forecasts for each asset are based on a number of inputs (see interim report for more detail). The sensitivity assumes a 10% increase or decrease in power prices relative to the base case for each year of the asset life.
The sensitivity reflects the market-linked proportion of portfolio revenues, which varies by asset and jurisdiction. This exposure is actively managed through a combination of contracted revenues and geographical diversification.
4. Inflation
The sensitivity assumes a 0.5% increase or decrease in inflation relative to the base case for each year of the asset life.
The inflation sensitivity reflects the balance of fixed and inflation-linked revenues across the portfolio. Exposure varies by asset, depending on contractual terms and regulatory regimes. The portfolio as a whole offers moderate protection against changes in inflation assumptions, contributing to its resilience in different macroeconomic environments.
5. Foreign exchange
As at 30 June 2025, 48% of the portfolio NAV is euro denominated. The sensitivity applied above shows the impact on NAV per share of a +/- 10% movement in the EUR/GBP exchange rate.
Exposure to FX movements is managed through a structured hedging programme covering both forecast distributions and construction commitments (where relevant). The resulting NAV sensitivity to currency movements is limited, and the hedging approach continues to provide effective mitigation of short-term exchange rate volatility.
NAV sensitivities per Ordinary Share (including Conditional Acquisitions)
Power Prices and Green Certificates
The combination of forward market prices and independent long-term power price forecasts, together with the power purchase agreements ("PPAs") which the Investment Manager has originated, make up the portfolio's forecast power only generation-weighted price ("Power only GWP"). The generation-weighted price, including subsidies and additional benefits ("Total GWP"), is derived by including subsidies and additional benefits, such as green certificates. The Power only GWP and Total GWP for the period to 2050 are shown in Figure 12 below. The curves are blended across the markets in which the portfolio's generation assets are located, weighted by the portfolio generation mix and converted into £/MWh. On average, the graph shows power only GWP of £57.48/MWh in the period 2025-2029 and £48.51/MWh in the period 2030-2050.
While short-term movements in electricity market forward prices (which are incorporated into our assets' valuations) have resulted in a slight decrease in the GWP over the short term relative to six months prior, the high proportion of fixed revenues in the portfolio (detailed further in the Portfolio Revenue Forecasts section in the interim report) helps to limit the portfolio's exposure to volatility in the power market. Longer term, the portfolio's GWP remains broadly unchanged.
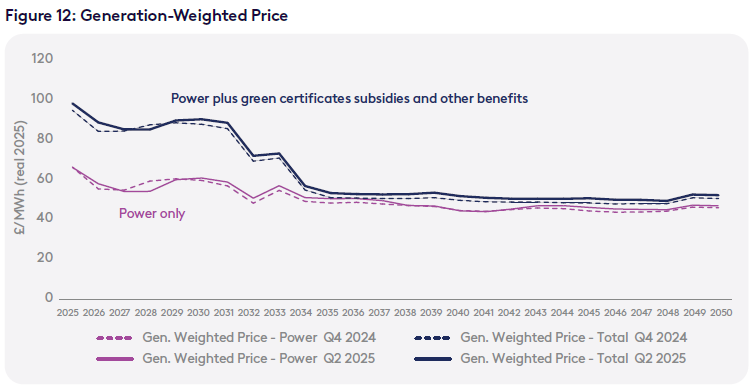
Sources: Forward prices based on ICIS, Nasdaq, EEX and TGE data. (Q2 2025). Forecast data from independent market advisers.
A summary of the capture price discounts utilised in the assets' valuations is presented below in Figure 131. The percentages are the average differences between the generation-weighted and time-weighted power prices. These assumptions are provided by third party advisors and use site-specific assumptions for onshore and offshore wind.
Figure 13: Capture price discounts assumptions
|
Value |
Market |
Technology |
Units |
2025-2029 |
2030-2034 |
2035-2039 |
2040-2044 |
2045-2050 |
|
Baseload price |
GB |
NA |
£/MWh (real 2025) |
73 |
73 |
73 |
68 |
66 |
|
Capture price discount |
GB |
Solar |
% |
21% |
24% |
24% |
25% |
28% |
|
Capture price discount |
GB |
Onshore Wind |
% |
11% |
19% |
22% |
25% |
26% |
|
Capture price discount |
GB |
Offshore Wind |
% |
13% |
18% |
22% |
24% |
25% |
|
Baseload price |
FR |
NA |
EUR/MWh (real 2025) |
NA |
77 |
80 |
77 |
73 |
|
Capture price discount |
FR |
Onshore Wind |
% |
NA |
NA |
NA |
11% |
11% |
|
Capture price discount |
FR |
Solar |
% |
NA |
41% |
41% |
41% |
42% |
|
Baseload price |
FI |
NA |
EUR/MWh (real 2025) |
43 |
64 |
65 |
66 |
64 |
|
Capture price discount |
FI |
Onshore Wind |
% |
18% |
19% |
21% |
22% |
22% |
|
Baseload price |
DE |
NA |
EUR/MWh (real 2025) |
NA |
NA |
NA |
81 |
78 |
|
Capture price discount |
DE |
Onshore Wind |
% |
NA |
NA |
NA |
23% |
27% |
|
Baseload price |
I-SEM |
NA |
EUR/MWh (real 2025) |
NA |
NA |
NA |
88 |
88 |
|
Capture price discount |
I-SEM |
Solar |
% |
NA |
NA |
NA |
21% |
23% |
Source: Forecast data from independent market advisers.
1 Values are not shown where the relevant asset has no merchant exposure in three or more years in the relevant period.
Portfolio Revenue Forecasts
Figure 14 in the interim report presents ORIT's forecast revenues to 2050 categorised by price structure and presented as a proportion of the relevant year's total forecast revenues. Fixed revenues derive from either fixed price subsidies ("Fixed - Subsidy") or fixed price via PPA or other revenue hedging tool ("Fixed - Power"), and variable revenues derive from power being sold on a merchant basis ("Variable - Power") or other sources of variable revenue (green certificates being one example) ("Variable - Other").
For the 24 months to 30 June 2027 85% of total forecast revenues are fixed (an increase of 1% from six months prior) due to a decrease in the value of near-term variable revenues as well as hedges placed across ORIT's GB solar portfolio. On a net present value basis, 50% of the portfolio's value is derived from fixed price revenues, and 50% from variable revenues.
All of ORIT's power price hedges are structured on a pay-as-produced basis. This contrasts with other commonly observed hedge structures - such as baseload or fixed shape hedges - which require the asset to assume additional (often costly) risks, especially during periods of underproduction, given the need to buy back power at the market price in order to deliver under the hedge's baseload or fixed shape generation profile.
In addition, ORIT's portfolio continues to retain a high proportion of contractually inflation-linked revenues, shown in Figure 15 in the interim report. These not only derive from government subsidies, but also from inflation-linked corporate PPAs which the Investment Manager has originated in-house, such as the PPAs between Crossdykes wind farm and Sky
These are forward-looking statements based upon certain assumptions. Actual events may differ materially from those assumed.
Financial Review
The financial statements of the Company for the period ended 30 June 2025 are set out below (see interim report for more detail). These financial statements have been prepared in accordance with international accounting standards in conformity with the requirements of the Companies Act 2006 and the applicable legal requirements of the Companies Act 2006. In order to continue providing useful and relevant information to its investors, the financial statements also refer to the "intermediate holding companies", which comprise the Company's wholly owned subsidiary,
Net assets
Net assets have decreased from £570.4 million as at 31 December 2024 to £540.4 million as at 30 June 2025, largely due to a decrease in the fair value of portfolio of assets as described in the Portfolio Valuation section above.
The net assets as at 30 June 2025 comprise the fair value of the Company's investments of £532.3 million (FY 2024: £561.3m), the Company's cash balance of £0.2 million (2024: £11.9m), and £7.9 million of the Company's other net assets (2024: £2.8 million net liabilities).
Included in the fair value of the Company's investments are net liabilities of £160.8 million (2024: net liabilities of £138.3m) held in the intermediate holding companies. The net liabilities comprise cash of £15.3 million (FY 2024: £7.1m), the positive mark-to-market value of the FX hedges taken out to minimise the volatility of cashflows associated with non-
Results as at 30 June 2025
|
|
30 June 2025 |
31 December 2024 |
|
|
£m |
£m |
Fair value of portfolio of assets |
693.1 |
699.6 |
|
Cash held in intermediate holding companies |
15.3 |
7.1 |
|
Bank loans and accrued interest held in the intermediate holding companies |
(168.4) |
(151.2) |
|
Fair value of other net (liabilities)/assets in intermediate holding companies |
(7.7) |
5.8 |
|
Fair value of Company's investments |
532.3 |
561.3 |
|
Company's cash |
0.2 |
11.9 |
|
Company's other net assets/(liabilities) |
7.9 |
(2.8) |
|
Net asset value as at the reporting date |
540.4 |
570.4 |
|
Number of shares (excluding treasury shares) (million) |
543.4 |
555.7 |
|
Net asset value per share (pence) |
99.46 |
102.65 |
Income
In accordance with the Statement of Recommended Practice: Financial Statements of Investment Trust Companies and Venture Capital Trusts ("SORP") issued in July 2022 by the Association of Investment Companies ("AIC"), the statement of comprehensive income differentiates between the 'revenue' account and the 'capital' account, and the sum of both items equals the Company's profit for the year. Items classified as capital in nature either relate directly to the Company's investment portfolio or are costs deemed attributable to the long-term capital growth of the Company (such as a portion of the Investment Manager's fee).
In the six-month period ended 30 June 2025, the Company's operating income was £22.6 million (HY 2024: £18.9m), including interest income of £12.5 million (HY 2024: £12.7m), dividends receivable of £10.0 million (HY 2024: £6.0m) and a net loss on the movement of fair value of investments of £23.7 million (HY 2024: loss of £4.1m). The operating expenses included in the statement of comprehensive income for the year were £3.4 million (HY 2024: £3.5m). These comprise £2.6 million of Investment Manager fees (HY 2024: £2.8m), and other operating expenses of £0.8 million (HY 2024: £0.7m). The details on how the Investment Manager's fees are charged are set out in notes 5 and 17 to the financial statements for the year ended 31 December 2024.
Ongoing charges
The ongoing charges ratio ("OCR") is a measure of the regular recurring annual costs of running the Company, expressed as a percentage of average net assets. It has been calculated and disclosed in accordance with the AIC methodology, as the annualised ongoing charges (i.e. excluding acquisition costs and other non-recurring items) divided by the average published undiluted Net Asset Value in the year. For the year ended 31 December 2024, the ratio was 1.21% and it is anticipated that the full-year ratio for the year ended 31 December 2025 will be 1.25%.
Dividends
During the six months to 30 June 2025, interim dividends totalling £16.8 million were paid - 1.51p per share paid in respect of the quarter to 31 December 2024 (paid in February 2025) and 1.54p per share in respect of the first quarter of 2025 (paid in May 2025).
Post-period end, a further interim dividend of 1.54p per share was paid on 29 August 2025, to shareholders recorded on the register on 15 August 2025, in respect of the quarter ended 30 June 2025.
Dividend cover - operational cash flows (portfolio level)
For the first half of 2025, the Company's net cash flows from operations, pre debt amortisation of £30.5 million, and post external debt amortisation of £20.0 million supported the payment of £16.8 million dividends to shareholders for the period, resulting in a dividend coverage of 1.81x and 1.19x respectively. ORIT's key portfolio characteristics of diversification, high proportion of fixed revenues and inflation-linkage help maintain a growing, covered dividend.
Full year dividends, based on the stated target of 6.17 pence per share1, are expected to remain fully covered for the full year. While the Company remains confident in its ability to meet its dividend targets for the year, actual coverage will ultimately depend on a range of factors, including asset-level performance, power market conditions and the scale and timing of further buybacks. The Investment Manager continues to monitor these dynamics closely as part of its active portfolio and capital management strategy.
1 The dividend target is a target only and not a profit forecast. There can be no assurance that this target will be met, or that the Company will make any distributions at all and it should not be taken as an indication of the Company's expected future results. The Company's actual returns will depend upon a number of factors, including but not limited to the Company's net income and level of ongoing charges. Accordingly, potential investors should not place any reliance on this target and should decide for themselves whether or not the target dividend is reasonable or achievable. Investors should note that references in this announcement to "dividends" and "distributions" are intended to cover both dividend income and income which is designated as an interest distribution for
Six-month period ended 30 June 2025
|
|
6 months to |
6 months to |
|
£ million unless stated |
30 June 2025 |
30 June 2024 |
|
Operational cash flows |
|
|
|
|
14.1 |
9.5 |
|
French Solar |
4.9 |
5.2 |
|
Swedish Wind (includes lock-box interest only to 30-Jun-24) |
- |
2.3 |
|
Finnish Wind |
4.1 |
5.4 |
|
French Wind |
1.6 |
1.3 |
|
|
1.2 |
1.8 |
|
|
4.9 |
6.0 |
|
|
6.2 |
9.4 |
|
|
6.3 |
3.8 |
|
Total |
43.2 |
44.8 |
|
SPV level taxes |
|
|
|
French Solar, Finnish Wind, |
-1.0 |
-1.3 |
|
Interest payable on external debt |
|
|
|
French Solar, French Wind, |
-4.5 |
-4.2 |
|
Operational cash flow pre debt amortisation |
37.8 |
39.3 |
|
Company and intermediate holding company level income and expenses2 |
-1.0 |
1.0 |
|
Interest and fees payable on RCF |
-6.3 |
-7.5 |
|
Net cash flow from operating activities pre debt amortisation |
30.5 |
32.9 |
|
Dividends paid in respect of year |
16.8 |
17.0 |
|
Portfolio level operational cash flow dividend cover pre debt amortisation |
1.8x |
1.9x |
|
External debt amortisation |
|
|
|
French Solar, French Wind, |
-10.5 |
-10.3 |
|
Net cash flow from operating activities |
20.0 |
22.6 |
|
Dividends paid in respect of year |
16.8 |
17.0 |
|
Portfolio level operational cash flow dividend cover |
1.19x |
1.33x |
|
Note: Totals may not add up due to rounding. 1 Taxes falling due on operational asset trading profits (e.g. Corporation Tax in the 2 Company and intermediate holding company level income and expenses includes receipt of favourable mark-to-market movements on foreign currency forward contracts.
|
|
|
ESG & Impact Report
ESG & Impact Strategy
ORIT classifies itself an impact fund with a core impact objective to accelerate the transition to net zero through its investments, building and operating a diversified portfolio of renewable energy assets.
ORIT enables individuals and institutions to participate in the energy transition. The renewable energy generated from its portfolio of assets supports the transition to net zero by replacing unsustainable energy sources with clean power. This intended outcome is the Company's core impact objective.
The ESG & Impact Strategy considers ORIT's culture, values and activities through three lenses: Performance, Planet and People - to ensure that ORIT's activities integrate ESG risks and promote additional impact opportunities.
For a more in-depth understanding of ORIT's ESG & Impact Strategy, encompassing definitions of ESG and Impact, along with detailed insights into four impact themes: stakeholder engagement, equality and wellbeing, innovation, and sustainable momentum), please refer to the separately published ESG & Impact Strategy.
Stewardship and Engagement
The Investment Manager manages ORIT's investments in line with its Engagement and Stewardship Policy. More detail can be found in the Company's 2024 Annual Report on page 67 and the Investment Manager's full Engagement and Stewardship Policy can be viewed at: https://assets.octopusenergygeneration.com/x/d557d65717/oegen-engagement-and-stewardship-policy-august-2024-v-f.pdf
Regulatory Disclosures
ORIT is a supporter of the recommendations of the Task Force on Climate-related Financial Disclosures ("TCFD") and makes a TCFD disclosure in its 2024 Annual Report on page 93.
ORIT is classified as an Article 9 product under the EU Sustainable Finance Disclosure Regulation ("SFDR"). ORIT's most recent SFDR-related disclosures, including its Principal Adverse Impact Statement is available on its website:
https://www.octopusrenewablesinfrastructure.com/sustainability-related-disclosures
The breakdown of ORIT's investments' alignment to the EU Taxonomy can be found in the 2024 Annual Report on page 73.
|
Objective & Commitments |
Metrics |
H1 2025 |
H1 2024 |
|
|
Performance |
||||
|
Build and operate a diversified portfolio of renewable energy assets, mitigating the risk of losses through robust governance structures, rigorous due diligence, risk analysis and asset optimisation activities to deliver investment return resilience and the maximum amount of green energy.
|
Total value of sustainable investments, 100% of which committed into renewables |
£1,026m |
£1,118m |
|
|
Number of assets |
40 |
41 |
||
|
% investments that adhere to ORIT ESG policy and minimum ESG matrix threshold |
100% |
100% |
||
|
Renewable energy generated in H1 (excluding compensated generation) |
608 GWh |
605 GWh |
||
|
Potential annual renewable energy generation once fully operational |
1,397 GWh |
1,394 GWh |
||
|
Potential annual renewable energy generation from assets where ORIT has invested and committed at construction |
832 GWh |
825 GWh |
||
|
Planet |
||||
|
Consider environmental factors to mitigate risks associated with the construction and operation of assets, enhancing environmental potential where possible. |
In reference to renewable energy generated in H1 |
|
|
|
|
Estimated annual equivalent tonnes of CO2 avoided in H1 |
165k |
150k |
||
|
Estimated equivalent new trees required to avoid same CO2 in H1 |
0.8m |
0.7m |
||
|
Estimated equivalent cars off the road to avoid the same CO2 in H1 |
82k |
76k |
||
|
In reference to potential annual generation once fully operational |
|
|
||
|
Estimated equivalent tonnes of CO2 avoided once fully operational |
384k |
383k |
||
|
Estimated equivalent new trees required to avoid same CO2 once fully operational |
1.9m |
1.9m |
||
|
Estimated equivalent cars off the road required to avoid same CO2 once fully operational |
190k |
194k |
||
|
Other environmental metrics |
|
|
||
|
ORIT LSE Green Economy Mark demonstrating Company's significant contribution to transition to a zero-carbon economy. |
✔ |
✔ |
||
|
% Generating sites on renewable import tariffs |
94% |
91% |
||
|
Number of environmental incidents |
1 |
2 |
||
|
People |
|||
|
Evaluate social considerations to mitigate risks and promote a 'Just Transition' to clean energy. This includes: • Effectively managing ORIT's health and safety risks. • Ensuring diversity and inclusion in board appointments and subsidiary directorships. • Supporting decent jobs that uphold equal opportunity, workplace standards, diversity, and local employment. • Empowering communities through benefit schemes, school engagement, local charity support, and early stakeholder engagement to build social license. • Delivering affordable, clean energy to enhance energy security and reduce costs for end users. |
Health and Safety |
|
|
|
RIDDORs |
0 |
0 |
|
|
Lost time injuries (>7 days) |
0 |
0 |
|
|
Near misses |
5 |
9 |
|
|
Personal Injuries (first aid) |
4 |
1 |
|
|
Minor equipment damage incidents |
4 |
15 |
|
|
Diversity & Inclusion |
|
|
|
|
Compliance with the |
✔ |
✔ |
|
|
Just Transition |
|
|
|
|
Estimated FTE jobs supported |
42 |
51 |
|
|
£ per year of community benefit funds |
£1,013,000 |
£1,203,000 |
|
|
£ of annual impact budget |
£343,000 |
£340,000 |
|
|
Number of people benefitting from social initiatives1 |
4,034 |
148 |
|
|
Estimated equivalent homes powered by renewable electricity generation by ORIT's assets in H1. |
158k |
147k |
|
|
|
|
|
|
1 H1 2024 metric reflects only student beneficiaries, whereas H1 2025 encompasses both student beneficiaries and all other beneficiary groups
Case study
Delivering skills for the energy transition
As part of its commitment to a just transition, ORIT partnered with the Energy Skills Partnership ("ESP") to help deliver practical training for careers in clean energy. ESP is a national organisation that connects industry needs with skills development. It creates and runs initiatives that provides people with the knowledge needed to work in the net zero economy. All of ESP's work is focused on supporting a fair and inclusive shift to a low-carbon future.
This partnership is delivering two targeted initiatives:
1 The creation of 'Futures in Offshore Wind', a structured online course designed to familiarise new entrants with how the offshore wind sector works and
2 The deployment of virtual reality headsets to support inclusive technical training in offshore wind.
These initiatives aim to improve access to renewable energy careers and technical training, with a focus on workforce readiness and inclusion. While ESP currently operates mainly in
4 - QUALITY EDUCATION
4.1, 4.5 & 4.7 - Provide free, quality education leading to effective learning outcomes that can also promote sustainable development. Implement this whilst eliminating gender disparities and ensuring equal access to all levels of education
ESP-led initiatives provide accessible, technical training through online and immersive learning tools, equipping individuals with skills for employment in the clean energy sector. Long-term partnership with the Good
7 - AFFORDABLE AND CLEAN ENERGY
7.1, 7.2 & 7.3 - By 2030, ensure universal access to affordable, reliable and modern energy services, increase the share of renewable energy in the global energy mix, and increase the global rate of energy efficiency 7.a - Cooperation with regards to research and investment in clean energy infrastructure and technology
Provided renewable energy to the grid and provided renewable investment opportunities.
8 - DECENT WORK AND ECONOMIC GROWTH
8.5 - Provide full and productive employment and decent work for all
Extensive Health and Safety measures ensures employees are not exposed to risk. Supply chain analysis and strengthened policies to ensure labour rights upheld across ORIT's suppliers.
10 - REDUCED INEQUALITIES
10.2 - By 2030, empower and promote the social, economic and political inclusion of all, irrespective of age, sex, disability, race, ethnicity, origin, religion or economic or other status
ORIT promotes inclusion through core business practices and financial support to other initiatives like the ESP-led programmes that further reduce barriers by offering free, flexible, and location-independent training pathways, enabling broader participation from underrepresented and remote communities.
13 - CLIMATE ACTION
13.1 - Strengthen resilience and adaptive capacity to climate related hazards and natural disasters.
13.3 - Improve education, awareness-raising and human and institutional capacity on climate change mitigation, adaptation, impact reduction and early warning
Biodiversity and habitat management plans proposed for most sites as planning requirement. Physical climate change risks considered and mitigated (e.g. flood risk mitigation strategy) and transition risks forecasted (e.g. low power price scenarios). Participation in working groups to improve climate risk assessment and disclosure. Through many of its initiatives, ORIT strives to increase education and awareness related to climate change and impact reduction.
15 - LIFE ON LAND
15.5 - Take urgent and significant action to reduce the degradation of natural habitats, halt the loss of biodiversity and, by 2020, protect and prevent the extinction of threatened species
Threatened and non-threatened species monitored through ecological surveys and biodiversity plans. Additional biodiversity initiatives implemented beyond planning requirement. Biodiverse pocket forests planted in partnership with SUGi to restore native biodiversity in urban areas and biodiversity-barren areas.
Interim Management Report
The Directors are required to provide an Interim Management Report in accordance with the
Risk and Risk Management
The Company's approach to risk governance and its risk review process are described in the Risk and Risk Management section of the 2024 Annual Report. The Board has reviewed the principal risks to the achievement of the Company's objectives as at 30 June 2025. Whilst the overall risk profile is considered to be materially unchanged from that reported in the 2024 Annual Report, certain developments have influenced individual risk areas during the period.
The Company's key risks continue to relate to energy markets and asset yields. Although wholesale price volatility has moderated during the reporting period, structural pressures such as capture price cannibalisation remain relevant. Weather variability also continues to affect generation yields. These risks are actively managed through a combination of revenue hedging and diversification across technologies and geographies, which together provide resilience to short-term movements.
Sector-wide market sentiment towards the renewables investment trust sector has weakened further over the past year, influenced by higher financing costs and broader investor caution. While not a direct operational risk for the Company, the Board recognises that market sentiment can affect valuation levels and access to capital.
Alongside these core risks, the Board has also noted developments in other areas. Regulatory risk has eased following confirmation that the
The Company continues to manage these risks through active portfolio oversight, diversification across technologies and geographies, and the expertise of the Investment Manager. The Impact Report, published on 27 March 2025, provides examples of targeted initiatives undertaken in the period to address certain risk areas.
Task Force on Climate-related Financial Disclosures ("TCFD")
The Company is acutely aware of the risks of climate change and through its investment mandate, believes it is well placed to contribute to solutions and harness the opportunities that arise from a transition to net zero.
However, no company is isolated from climate change, and the TCFD disclosures we make outline the climate-related risks ORIT faces. Our TCFD approach is detailed on pages 93 to 107 of the 2024 Annual Report. The Company is pleased to confirm that it has included climate-related financial disclosures aligned with the four recommendations and the eleven recommended disclosures provided in the TCFD's 2021 report 'Implementing the Recommendations of the Task Force on Climate-related Financial Disclosures', which included additional guidance for Asset Owners and Asset Managers.
Related Party Transactions
The Company's AIFM is considered a related party under the Listing Rules. Under the Management Agreement, the AIFM receives from the Company a management fee of 0.95% per annum of Net Asset Value up to and including £500 million and 0.85% per annum of Net Asset Value in excess of £500 million, payable quarterly in arrears. No performance fee or asset level fees are payable to the Investment Manager under the Management Agreement.
Management fees amounting to £2,568,000 were payable to the Investment Manager for the six months ended 30 June 2025 (six months ended 30 June 2024: £2,749,000).
Going Concern
The Directors have reviewed detailed cash flow forecasts prepared by the Investment Manager, based on prudent assumptions, and consider it appropriate to prepare the Company's financial statements on a going concern basis.
As at 30 June 2025 the Company held unrestricted cash of £15.5 million and had available headroom of £82.0 million under its RCF. The RCF, which was successfully refinanced in 2025, was decreased to £150 million and its maturity extended to 30 June 2028. At period end the Company's net assets were £540 million, while total expenses for the period were £3.4 million (c.1.2% of average net assets on an annualised basis). Covenant compliance has been tested and remains robust, with sufficient headroom even under downside scenarios.
The Company's revenues are generated from dividends and interest from the portfolio of investments, with cashflows underpinned by long-term power purchase agreements with established counterparties. While risks such as lower power prices, reduced output, or higher discount rates could affect valuations and distributions, the Directors do not consider there to be any immediate material risk to the Company's investment portfolio or income. Stress testing indicates the Company would continue to remain viable under such scenarios.
The Company's principal cash outflows relate to dividends, commitments to developer investments and contingent acquisitions. As at 30 June 2025, outstanding commitments of c. £33 million can be funded through a combination of existing cash balances and undrawn RCF capacity. The Directors are confident these resources are sufficient to meet obligations as they fall due.
On 13 June 2025, shareholders voted in favour of the continuation of the Company, with over 90% support. This provides additional reassurance of strong investor backing for the Company's strategy and long-term prospects.
Taking these factors into account, the Directors have concluded that it is appropriate to prepare the financial statements on a going concern basis.
Responsibility Statement of the Directors
The Directors acknowledge responsibility for the interim results and approve this Interim Report. The Directors confirm that to the best of their knowledge:
a) the condensed financial statements have been prepared in accordance with IAS 34 "Interim Financial Reporting" and give a true and fair view of the assets, liabilities and financial position and the profit of the Company as required by the
b) the interim management report, included within the Chair's Statement and Investment Manager's Report, includes a fair review of the information required by DTR 4.2.7R and DTR 4.2.8R.
This responsibility statement has been approved by the Board.
Philip Austin MBE
Chair
22 September 2025
Financial Statements
Income Statement
For the six months ended 30 June 2025 (unaudited)
|
|
|
For the six months ended |
For the six months ended |
For the year ended |
||||||
|
|
|
30 Jun 2025 (unaudited) |
30 Jun 2024 (unaudited) |
31 Dec 2024 (audited) |
||||||
|
|
|
Revenue |
Capital |
Total |
Revenue |
Capital |
Total |
Revenue |
Capital |
Total |
|
|
Notes |
£'000 |
£'000 |
£'000 |
£'000 |
£'000 |
£'000 |
£'000 |
£'000 |
£'000 |
|
Losses on investments |
|
- |
(23,715) |
(23,715) |
- |
(4,106) |
(4,106) |
- |
(24,030) |
(24,030) |
|
Income from investments |
3 |
22,478 |
- |
22,478 |
18,724 |
- |
18,724 |
42,541 |
- |
42,541 |
|
Other interest receivable and similar income |
3 |
120 |
- |
120 |
159 |
- |
159 |
301 |
- |
301 |
|
Gross return/(loss) |
|
22,598 |
(23,715) |
(1,117) |
18,883 |
(4,106) |
14,777 |
42,842 |
(24,030) |
18,812 |
|
Investment management fees |
|
(1,926) |
(642) |
(2,568) |
(2,062) |
(687) |
(2,749) |
(4,104) |
(1,368) |
(5,472) |
|
Other expenses |
|
(793) |
- |
(793) |
(728) |
- |
(728) |
(1,563) |
- |
(1,563) |
|
Net return/(loss) before taxation |
|
19,879 |
(24,357) |
(4,478) |
16,093 |
(4,793) |
11,300 |
37,175 |
(25,398) |
11,777 |
|
Taxation |
4 |
- |
- |
- |
(171) |
171 |
- |
(342) |
342 |
- |
|
Net return/(loss) after taxation |
|
19,879 |
(24,357) |
(4,478) |
15,922 |
(4,622) |
11,300 |
36,833 |
(25,056) |
11,777 |
|
Return/(loss) per share |
5 |
3.61p |
(4.42)p |
(0.81)p |
2.82p |
(0.82)p |
2.00p |
6.55p |
(4.45)p |
2.10p |
The "Total" column of this statement is the profit and loss account of the Company. The "Revenue" and "Capital" columns represent supplementary information prepared under guidance issued by The Association of Investment Companies. The Company has no other items of other comprehensive income, and therefore the net return/(loss) after taxation is also the total comprehensive income/(loss) for the period. All revenue and capital items in the above statement derive from continuing operations. No operations were acquired or discontinued in the period.
Statement of Financial Position
at 30 June 2025 (unaudited)
|
|
|
30 Jun 2025 |
30 Jun 2024 |
31 Dec 2024 |
|
|
|
(unaudited) |
(unaudited) |
(audited) |
|
|
Notes |
£'000 |
£'000 |
£'000 |
|
Fixed assets |
|
|
|
|
|
Investments at fair value through profit or loss |
7,11 |
532,318 |
582,665 |
561,296 |
|
Current assets |
|
|
|
|
|
Other debtors |
8 |
10,049 |
138 |
23 |
|
Cash and cash equivalents |
|
176 |
11,822 |
11,852 |
|
|
|
10,225 |
11,960 |
11,875 |
|
Creditors: amounts falling due within one year |
|
|
|
|
|
Other creditors and accruals |
|
(2,110) |
(1,839) |
(2,801) |
|
Net current assets |
|
8,115 |
10,121 |
9,074 |
|
Total assets less current liabilities |
|
540,433 |
592,786 |
570,370 |
|
Net assets |
|
540,433 |
592,786 |
570,370 |
|
Capital and reserves |
|
|
|
|
|
Share capital |
9 |
5,649 |
5,649 |
5,649 |
|
Share premium |
|
217,283 |
217,283 |
217,283 |
|
Special reserve |
|
323,978 |
338,613 |
332,590 |
|
Capital reserve |
|
(35,657) |
9,134 |
(11,300) |
|
Revenue reserve |
|
29,180 |
22,107 |
26,148 |
|
Total equity shareholders' funds |
|
540,433 |
592,786 |
570,370 |
|
Net asset value per share |
10 |
99.46p |
105.15p |
102.65p |
Statement of Changes in Equity
Six months ended 30 June 2025 (unaudited)
|
|
|
Share |
Share |
Special |
Capital |
Revenue |
|
|
|
|
capital |
premium |
reserve |
reserve |
reserve |
Total |
|
|
Notes |
£'000 |
£'000 |
£'000 |
£'000 |
£'000 |
£'000 |
|
At 31 December 2024 |
|
5,649 |
217,283 |
332,590 |
(11,300) |
26,148 |
570,370 |
|
Repurchase of the Company's own shares into treasury |
|
- |
- |
(8,542) |
- |
- |
(8,542) |
|
Costs of share repurchases |
|
- |
- |
(70) |
- |
- |
(70) |
|
(Loss)/return for the period |
|
- |
- |
- |
(24,357) |
19,879 |
(4,478) |
|
Dividends paid in the period |
6 |
- |
- |
- |
- |
(16,847) |
(16,847) |
|
At 30 June 2025 |
|
5,649 |
217,283 |
323,978 |
(35,657) |
29,180 |
540,433 |
Six months ended 30 June 2024 (unaudited)
|
|
|
Share |
Share |
Special |
Capital |
Revenue |
|
|
|
|
capital |
premium |
reserve |
reserve |
reserve |
Total |
|
|
Notes |
£'000 |
£'000 |
£'000 |
£'000 |
£'000 |
£'000 |
|
At 31 December 2023 |
|
5,649 |
217,283 |
339,500 |
13,756 |
22,851 |
599,039 |
|
Repurchase of the Company's own shares into treasury |
|
- |
- |
(883) |
- |
- |
(883) |
|
Costs of share repurchases |
|
- |
- |
(4) |
- |
- |
(4) |
|
(Loss)/return for the period |
|
- |
- |
- |
(4,622) |
15,922 |
11,300 |
|
Dividends paid in the period |
6 |
- |
- |
- |
- |
(16,666) |
(16,666) |
|
At 30 June 2024 |
|
5,649 |
217,283 |
338,613 |
9,134 |
22,107 |
592,786 |
Year ended 31 December 2024 (audited)
|
|
|
Share |
Share |
Special |
Capital |
Revenue |
|
|
|
|
capital |
premium |
reserve |
reserve |
reserve |
Total |
|
|
Notes |
£'000 |
£'000 |
£'000 |
£'000 |
£'000 |
£'000 |
|
At 31 December 2023 |
|
5,649 |
217,283 |
339,500 |
13,756 |
22,851 |
599,039 |
|
Repurchase of the Company's own shares into treasury |
|
- |
- |
(6,837) |
- |
- |
(6,837) |
|
Costs of share repurchases |
|
- |
- |
(73) |
- |
- |
(73) |
|
(Loss)/return for the year |
|
- |
- |
- |
(25,056) |
36,833 |
11,777 |
|
Dividends paid in the year |
6 |
- |
- |
- |
- |
(33,536) |
(33,536) |
|
At 31 December 2024 |
|
5,649 |
217,283 |
332,590 |
(11,300) |
26,148 |
570,370 |
Statement of Cash Flows
For the six months ended 30 June 2025 (unaudited)
|
|
|
Six months |
Six months |
|
|
|
|
ended |
ended |
Year ended |
|
|
|
30 Jun 2025 |
30 Jun 2024 |
31 Dec 2024 |
|
|
|
(unaudited) |
(unaudited) |
(audited) |
|
|
Notes |
£'000 |
£'000 |
£'000 |
|
Operating activities |
|
|
|
|
|
Net (loss)/return before taxation |
|
(4,478) |
11,300 |
11,777 |
|
Movement in fair value of investments |
7 |
23,715 |
4,106 |
24,030 |
|
Income from investments |
3 |
(22,478) |
(18,724) |
(42,541) |
|
(Increase)/decrease in other debtors |
|
(10,026) |
5 |
120 |
|
Decrease in other creditors |
|
(691) |
(1,398) |
(436) |
|
Net cash outflow from operating activities |
|
(13,958) |
(4,711) |
(7,050) |
|
Investing activities |
|
|
|
|
|
Distributions from investments |
7 |
28,079 |
24,627 |
49,913 |
|
Additional investments |
|
(338) |
(553) |
(577) |
|
Net cash inflow from investing |
|
27,741 |
24,074 |
49,336 |
|
Financing activities |
|
|
|
|
|
Dividends paid |
6 |
(16,847) |
(16,666) |
(33,536) |
|
Repurchase of the company's own shares into treasury |
9 |
(8,542) |
(883) |
(6,837) |
|
Costs of share repurchases |
9 |
(70) |
(4) |
(73) |
|
Net cash outflow from financing |
|
(25,459) |
(17,553) |
(40,446) |
|
(Decrease)/increase in cash |
|
(11,676) |
1,810 |
1,840 |
|
Cash and cash equivalents at start of period |
|
11,852 |
10,012 |
10,012 |
|
Cash and cash equivalents at end of period |
|
176 |
11,822 |
11,852 |
Notes to the Accounts
For the period ended 30 June 2025
1. Financial statements
The information contained within the financial statements in this half year report has not been audited or reviewed by the Company's independent auditor.
The figures and financial information for the year ended 31 December 2024 are extracted from the latest published financial statements of the Company and do not constitute statutory financial statements for that year. Those financial statements have been delivered to the Registrar of Companies and included the report of the auditor which was unqualified and did not contain a statement under either section 498(2) or 498(3) of the Companies Act 2006.
This half year report will be made available to the public at the registered office of the Company. The report will be available in electronic format on the Company's website (https://octopusrenewablesinfrastructure.com).
2. Accounting policies
(a) Basis of preparation
The financial statements have been prepared in accordance with International Accounting Standard 34 "Interim Financial Reporting" and the accounting policies set out in the statutory accounts of the Company for the year ended 31 December 2024. Where presentational guidance set out in the Statement of Recommended Practice (the "SORP") for investment trusts issued by the Association of Investment Companies in July 2022, is consistent with the requirements of International Financial Reporting Standards, the financial statements have been prepared on a basis compliant with the recommendations of the SORP.
(b) Basis of non-consolidation
The Company has one wholly owned direct subsidiary, ORIT Holding II Limited, whose purpose is to invest the funds of ORIT. The Company and its subsidiary both meet the requirements to be classified as an investment entity as defined in International Financial Reporting Standard 10 "Consolidated Financial Statements". Consequently, the Company measures its subsidiary at fair value through profit or loss and does not prepare consolidated financial statements.
(c) Fair value calculations
The underlying investments are valued by the investment manager, using discounted cash flow techniques. The policy on valuation of investments is consistent with that detailed in note 2 to the financial statements for the year ended 31 December 2024, presented on pages 167 - 170 of the annual report and note 9(c) on pages 178 - 179 of the annual report.
(d) Accounting estimates
In common with many other investment companies, the Board has chosen to adopt the 'allocation approach', as set out in the SORP, and has determined that the basis of allocation of certain expenses to capital should reflect the Directors' estimate of the future long-term split of returns in the form of capital gains and income. Accordingly, the Company allocates 25% of the management fee and 25% of any finance costs to capital and the remaining 75% to revenue. The Board monitors the assumptions that underpin the basis of allocation.
3. Income
|
|
Six months ended |
Six months ended |
Year ended |
|
|
30 Jun 2025 |
30 Jun 2024 |
31 Dec 2024 |
|
|
(unaudited) |
(unaudited) |
(audited) |
|
|
£'000 |
£'000 |
£'000 |
|
Dividends |
10,000 |
6,000 |
17,000 |
|
Investment interest income |
12,478 |
12,724 |
25,541 |
|
Income from investments |
22,478 |
18,724 |
42,541 |
|
Interest from money market funds |
120 |
159 |
301 |
|
Total income |
22,598 |
18,883 |
42,842 |
4. Taxation
The Company's effective corporation tax rate is nil, as deductible expenses and interest distributions exceed taxable income. Any tax relief obtained on expenses allocated to capital is credited to the capital account in accordance with the requirements of the SORP.
5. Return/(loss) per share
|
|
Six months ended |
Six months ended |
Year ended |
|
|
30 Jun 2025 |
30 Jun 2024 |
31 Dec 2024 |
|
|
(unaudited) |
(unaudited) |
(audited) |
|
Revenue return after taxation (£'000) |
19,879 |
15,922 |
36,833 |
|
Capital loss after taxation (£'000) |
(24,357) |
(4,622) |
(25,056) |
|
(Loss)/return after tax (£'000) |
(4,478) |
11,300 |
11,777 |
|
Weighted average number of shares in issue during the period |
550,764,715 |
564,806,017 |
562,473,374 |
|
Revenue return per share |
3.61p |
2.82p |
6.55p |
|
Capital loss per share |
(4.42)p |
(0.82)p |
(4.45)p |
|
Total (loss)/return per share |
(0.81)p |
2.00p |
2.10p |
There are no diluted returns per share as there are no dilutive or potentially dilutive instruments in issue.
6. Dividends paid
|
|
Six months ended |
Six months ended |
Year ended |
|
|
30 Jun 2025 |
30 Jun 2024 |
31 Dec 2024 |
|
|
(unaudited) |
(unaudited) |
(audited) |
|
|
£'000 |
£'000 |
£'000 |
|
Q4 2024 dividend paid of 1.51p (2023: 1.45p) |
8,380 |
8,191 |
8,191 |
|
Q1 2025 dividend paid of 1.54p (2024: 1.50p) |
8,467 |
8,475 |
8,475 |
|
Q2 2024 dividend paid of 1.51p |
- |
- |
8,493 |
|
Q3 2024 dividend paid of 1.50p |
- |
- |
8,377 |
|
|
16,847 |
16,666 |
33,536 |
An interim dividend of 1.54p (2024: 1.51p) per share, amounting to £8,279,866 (2024: £8,493,000), has been declared payable in respect of Q2 2025. This dividend was paid on 29 August 2025 to shareholders on the register on 15 August 2025.
7. Investments at fair value through profit or loss
(a) Changes in the valuation of the Company's direct holding in its subsidiary,
|
|
Six months ended |
Six months ended |
Year ended |
|
|
30 Jun 2025 |
30 Jun 2024 |
31 Dec 2024 |
|
|
(unaudited) |
(unaudited) |
(audited) |
|
|
£'000 |
£'000 |
£'000 |
|
Opening balance of the subsidiary at fair value |
561,296 |
592,121 |
592,121 |
|
Additional investment |
338 |
553 |
577 |
|
Distributions received |
(28,079) |
(24,627) |
(49,913) |
|
Investment income |
22,478 |
18,724 |
42,541 |
|
Movement in fair value |
(23,715) |
(4,106) |
(24,030) |
|
Closing balance of the subsidiary at fair value |
532,318 |
582,665 |
561,296 |
(b) Reconciliation of movement in the fair value of the Company's underlying portfolio of investments
|
|
Six months ended |
Six months ended |
Year ended |
|
|
30 Jun 2025 |
30 Jun 2024 |
31 Dec 2024 |
|
|
(unaudited) |
(unaudited) |
(audited) |
|
|
£'000 |
£'000 |
£'000 |
|
Opening balance |
699,604 |
705,970 |
705,970 |
|
Purchases of investments |
8,901 |
87,566 |
104,229 |
|
Sales of investments |
- |
- |
(62,077) |
|
Distributions received from investments |
(27,029) |
(41,596) |
(69,006) |
|
Movement in fair value of investments |
11,588 |
14,784 |
20,488 |
|
Fair value of the underlying portfolio of investments at the end of the period |
693,064 |
766,724 |
699,604 |
|
Cash held in the intermediate holding companies |
15,333 |
7,262 |
7,075 |
|
Bank loan drawn down by the intermediate holding companies |
(168,365) |
(196,243) |
(151,243) |
|
Fair value of other net assets and (liabilities) held by the intermediate holding companies |
(7,714) |
4,922 |
5,860 |
|
Fair value of the Company's investments at the end of the period |
532,318 |
582,665 |
561,296 |
8. Other debtors
|
|
30 Jun 2025 |
30 Jun 2024 |
31 Dec 2024 |
|
|
(unaudited) |
(unaudited) |
(audited) |
|
|
£'000 |
£'000 |
£'000 |
|
Dividend receivable from subsidiary |
10,000 |
- |
- |
|
Other prepayments and receivables |
49 |
138 |
23 |
|
|
10,049 |
138 |
23 |
9. Share capital
Changes in called-up share capital during the period were as follows:
|
|
Six months ended |
Six months ended |
Year ended |
|
|
30 Jun 2025 |
30 Jun 2024 |
31 Dec 2024 |
|
|
(unaudited) |
(unaudited) |
(audited) |
|
|
£'000 |
£'000 |
£'000 |
|
Ordinary shares of 1p each, allotted, called-up and fully paid |
|
|
|
|
Opening balance of shares of 1p each, excluding shares held in treasury |
5,557 |
5,649 |
5,649 |
|
Repurchase of shares into treasury |
(123) |
(12) |
(92) |
|
Subtotal of shares of 1p each, excluding shares held in treasury |
5,434 |
5,637 |
5,557 |
|
Shares held in treasury |
215 |
12 |
92 |
|
Closing balance of shares of 1p each, including shares held in treasury |
5,649 |
5,649 |
5,649 |
Changes in the number of shares in issue during the period were as follows:
|
|
Six months ended |
Six months ended |
Year ended |
|
|
30 Jun 2025 |
30 Jun 2024 |
31 Dec 2024 |
|
|
(unaudited) |
(unaudited) |
(audited) |
|
Opening balance of shares in issue, excluding shares held in treasury |
555,658,774 |
564,927,536 |
564,927,536 |
|
Repurchase of shares into treasury |
(12,288,206) |
(1,200,962) |
(9,268,762) |
|
Closing balance of shares in issue, excluding shares held in treasury |
543,370,568 |
563,726,574 |
555,658,774 |
|
Closing balance of shares held in treasury |
21,556,968 |
1,200,962 |
9,268,762 |
|
Closing balance of shares in issue, including shares held in treasury |
564,927,536 |
564,927,536 |
564,927,536 |
During the period, the Company made market purchases of 12,288,206 of its own shares, nominal value £122,882, to hold in treasury, representing 2.2% of the shares outstanding at the beginning of the period. The total consideration paid for these shares amounted to £8,612,000, including transaction costs of £70,000. The reason for these purchases was to seek to manage the volatility of the share price discount to net asset value per share and to provide a degree of liquidity to the market.
10. Net asset value ("NAV") per share
|
|
30 Jun 2025 |
30 Jun 2024 |
31 Dec 2024 |
|
|
(unaudited) |
(unaudited) |
(audited) |
|
NAV (£'000) |
540,433 |
592,786 |
570,370 |
|
Closing balance of shares in issue, excluding shares held in treasury |
543,370,568 |
563,726,574 |
555,658,774 |
|
NAV per share |
99.46p |
105.15p |
102.65p |
11. Financial Instruments measured at fair value
The Company's financial instruments that are held at fair value comprise its investment portfolio. The recognition and measurement policies for financial instruments measured at fair value have not changed from those set out in the statutory accounts of the Company for the year ended 31 December 2024.
IFRS 13 requires that financial instruments held at fair value are categorised into a hierarchy comprising the following three levels:
Level 1 - valued using quoted prices in active markets.
Level 2 - valued by reference to valuation techniques using observable inputs other than quoted market prices included within Level 1.
Level 3 - valued by reference to valuation techniques using inputs that are not based on observable market data.
Categorisation within the hierarchy has been determined on the basis of the lowest level input that is significant to the fair value measurement of the relevant asset.
At 30 June 2025, the Company's investment portfolio was categorised as follows:
|
|
30 Jun 2025 |
30 Jun 2024 |
31 Dec 2024 |
|
|
(unaudited) |
(unaudited) |
(audited) |
|
|
£'000 |
£'000 |
£'000 |
|
Level 1 |
- |
- |
- |
|
Level 2 |
14,505 |
8,801 |
10,496 |
|
Level 3 |
517,813 |
573,864 |
550,800 |
|
Total |
532,318 |
582,665 |
561,296 |
There have been no transfers between Levels 1, 2 or 3 during the period (period ended 30 June 2024: nil). During the year ended 31 December 2024, there were transfers from Level 2 to Level 3 amounting to £22,700,000.
12. Events after the interim period that have not been reflected in the financial statements for the interim period
Since the interim date and up to (and including) 15 September 2025, which is the latest practicable date before publication of this report, the Company has made market purchases of 8,756,748 of its own shares to hold in treasury, for a total consideration of £6,224,690.
A dividend amounting to £10,000,000 was paid up to the Company by its subsidiary company,
The Directors have evaluated the period since the interim date and have not noted any other events which have not been reflected in the financial statements.
Other Information
Alternative Performance Measures ("APMs")
The financial measures below are classified as APMs as defined by the European Securities and Markets Authority. Under this definition, APMs include a financial measure of historical performance or financial position, other than a financial measure defined or specified in the applicable financial reporting framework. These measures are commonly used by investment companies to assess values, investment performance and operating costs. Numerical calculations are given where appropriate.
Performance of the Company's underlying operations investments
|
|
Output |
Revenue |
Opex |
EBITDA |
|
Operational portfolio |
30 June 2025: |
30 June 2025: |
30 June 2025: |
30 June 2025: |
|
|
654 GWh |
£68.7 million |
£24.4 million |
£44.3 million |
|
|
(30 June 2024: |
(30 June 2024: |
(30 June 2024: |
(30 June 2024: |
|
|
658 GWh) |
£68.7 million) |
£23.4 million) |
£45.3 million) |
|
Solar |
30 June 2025: |
30 June 2025: |
30 June 2025: |
30 June 2025: |
|
|
294 GWh |
£33.1 million |
£7.8 million |
£25.3 million |
|
|
(30 June 2024: |
(30 June 2024: |
(30 June 2024: |
(30 June 2024: |
|
|
220 GWh) |
£25.0 million) |
£6.5 million) |
£18.5 million) |
|
Onshore wind |
30 June 2025: |
30 June 2025: |
30 June 2025: |
30 June 2025: |
|
|
291 GWh |
£16.7 million |
£4.8 million |
£11.9 million |
|
|
(30 June 2024: |
(30 June 2024: |
(30 June 2024: |
(30 June 2024: |
|
|
354 GWh) |
£22.7 million) |
£5.3 million) |
£17.4 million) |
|
Offshore wind |
30 June 2025: |
30 June 2025: |
30 June 2025: |
30 June 2025: |
|
|
68 GWh |
£18.9 million |
£11.8 million |
£7.1 million |
|
|
(30 June 2024: |
(30 June 2024: |
(30 June 2024: |
(30 June 2024: |
|
|
84 GWh) |
£21.0 million) |
£11.6 million) |
£9.4 million) |
Discount
The amount by which the share price of an investment trust is lower (discount) or higher (premium) than the NAV per share. The discount or premium is expressed as a percentage of the NAV per share. If the shares are trading at a discount, investors would be paying less than the value attributable to the shares as calculated in accordance with generally accepted accounting practice. The discount or premium is expressed as a percentage of the NAV per share. The discount at the period end was as follows:
|
|
|
30 Jun 2025 |
30 Jun 2024 |
31 Dec 2024 |
|
NAV per share |
a |
99.46p |
105.15p |
102.65p |
|
Share price |
b |
73.40p |
72.00p |
68.00p |
|
Discount |
(b/a)-1 |
(26.2%) |
(31.5%) |
(33.8%) |
Gross asset value ("GAV")
The Company's gross assets comprises the Company's NAV plus the total debt held in (unconsolidated) subsidiaries.
|
|
|
30 Jun 2025 |
30 Jun 2024 |
31 Dec 2024 |
|
|
|
£m |
£m |
£m |
|
NAV |
a |
540.4 |
592.8 |
570.4 |
|
Total debt |
b |
469.9 |
504.7 |
458.4 |
|
GAV |
a+b |
1,010.3 |
1,097.5 |
1,028.8 |
Leverage
Total leverage represents total debt in the table above, expressed as a percentage of GAV.
Total value of all investments
A measure of committed asset value including total debt and equity commitments.
|
|
|
30 Jun 2025 |
30 Jun 2024 |
31 Dec 2024 |
|
GAV |
a |
1,010.3 |
1,097.5 |
1,028.8 |
|
Commitments on existing portfolio |
b |
10.2 |
15.5 |
12.5 |
|
Commitments on conditional acquisitions |
c |
23.1 |
36.9 |
0 |
|
GAV before adjusting for cash available for commitments |
(a+b+c)=d |
1,043.6 |
1,149.9 |
1,041.3 |
|
Less minimum of current commitments |
e |
-17.2 |
-32.4 |
-12.5 |
|
Total value of all investments |
d+e |
1,026.4 |
1,117.5 |
1,028.8 |
Dividend yield
Dividend yield represents the target annual dividend for the year, expressed as a percentage of the share price at 30 June 2025.
|
|
|
30 Jun 2025 |
30 Jun 2024 |
31 Dec 2024 |
|
Target annual dividend |
a |
6.17p |
6.02p |
6.02p |
|
Share price |
b |
73.40p |
72.00p |
68.00p |
|
Dividend yield |
a/b |
8.4% |
8.4% |
8.9% |
Ongoing charges ratio ("OCR")
The OCR is calculated in accordance with The Association of Investment Companies' recommended methodology and represents the annualised management fee and all other recurring operating expenses excluding any finance costs and transaction costs, expressed as a percentage of the average net asset values during the period.
|
|
|
Six months |
Six months |
|
|
|
|
ended |
ended |
Year ended |
|
|
|
30 Jun 2025 |
30 Jun 2024 |
31 Dec 2024 |
|
Annualised expenses (£'000) |
a |
6,834 |
6,992 |
7,035 |
|
Average NAV (£,000) |
b |
545,445 |
591,331 |
583,198 |
|
Ongoing charges Ratio ("OCR") |
a/b |
1.25% |
1.18% |
1.21% |
Total return
Total return is the combined effect of any dividends paid, together with the rise or fall in the NAV per share or share price. Total return statistics enable the investor to make performance comparisons between investment companies with different dividend policies. Any dividends received by a shareholder are assumed to have been reinvested in either the assets of the Company at its NAV per share at the time the shares were quoted ex-dividend (to calculate the NAV per share total return) or in additional shares of the Company (to calculate the share price total return).
Total returns for the six months ended 30 June 2025 are calculated as follows:
|
|
|
|
NAV |
|
|
|
Share price |
per share |
|
Value at 31 December 2024 |
a |
68.00p |
102.60p |
|
Dividends paid from IPO to 31 December 2024 |
b |
23.72p |
23.72p |
|
Value plus dividends paid to 31 December 2024 |
a+b=c |
91.72p |
126.32p |
|
Value at 30 June 2025 |
d |
73.40p |
99.46p |
|
Benefit of reinvesting dividends |
e |
3.38p |
(0.10)p |
|
Dividends paid in the six months ended 30¸June 2025 |
f |
3.05p |
3.05p |
|
Total returns for the six months ended 30 June 2025 |
[(b+d+e+f)/c]-1 |
12.9% |
(0.2)% |
Total returns from IPO to 30 June 2025 are calculated as follows:
|
|
|
|
NAV |
|
|
|
Share price |
per share |
|
Value at IPO (10 December 2019) |
a |
100.00p |
98.00p |
|
Value at 30 June 2025 |
b |
73.40p |
99.46p |
|
Benefit of reinvesting dividends |
c |
(1.78)p |
2.81p |
|
Dividends paid from IPO to 30 June 2025 |
d |
26.77p |
26.77p |
|
Total returns from IPO to 30 June 2025 |
[(b+c+d)/a]-1 |
(1.6)% |
31.7% |
Dividend cover
Dividend cover is calculated using net operational cash flows from the portfolio after debt service and company and intermediate holding company expenses, as follows:
|
|
Six months ended |
Six months ended |
|
|
30 June 2025 |
30 June 2024 |
|
Net operational cash flows (£'000) |
20.0 |
22.6 |
|
Dividends declared (£'000) |
16.8 |
17.0 |
|
Dividend cover |
1.19x |
1.33x |
RNS may use your IP address to confirm compliance with the terms and conditions, to analyse how you engage with the information contained in this communication, and to share such analysis on an anonymised basis with others as part of our commercial services. For further information about how RNS and the London Stock Exchange use the personal data you provide us, please see our Privacy Policy.