

Most of the recent productivity gains are intangible and “Off Balance Sheet” so don’t get captured by this simplistic equation.
Companies: Eland Oil & Gas
Afternoon all,
Sorry for the long absence. It was a combination of my available bandwidth shrinking significantly and my determination only to publish if I felt like I had something interesting to write about and the time to do it properly. As such, I won't be picking up the weekly cadence again but will be a little more sporadic.
For this piece I want to talk about productivity and why I think it’s being looked at in completely the wrong way. I also finish with a brief write-up of Eland Oil & Gas (LON: ELA) , a company that is not in a sector I usually focus on but I think is interesting at the moment. (Full disclosure, I do hold a beneficial interest).
The productivity fallacy
All we’ve heard about since the Budget the other week is how sluggish productivity is. It’s the buzzword of the month and, as usual, the headlines paint a distorted and far too simplistic picture.
The formula used is pretty simple. Productivity is the ratio of the value of goods and services produced to the cost of all the inputs for those goods and services.
Productivity = Value of outputs / Value of inputs
Looked at through the simple lens of the productivity formula, I admit it appears we’ve had a decade of no progress. However, anyone who looks at the progress made over the last decade should instinctively know this is misleading.
The main issue is that most of the “Value” of the outputs can’t be measured…
Read more about Productivity Fallacy by Royal Economic society here.
Most productivity gains over the last decade have been “off Balance Sheet.”
The technological progress made in most sectors over the last ten years has been astounding. Consumers are getting far more and paying far less for so many goods and services they consume. The primary areas where this isn’t the case our those industries that are either heavily regulated (e.g. Healthcare) or heavily unionised (e.g. Transport).
Mobile phone evolution shows how misleading productivity formula is:
An iPhone contract costs around £30/month but the value it brings to a consumer is far higher.
Back in the early 2000’s, we spent broadly the same on telecommunications as we do now, primarily through landlines and the ubiquitous but much loved Nokia brick. In exchange, we could call and text people. Those ambitious enough to want to send pictures had to spend £60/month or more.
Now you walk around with more processing power in your pocket than it took to put people on the moon, and virtually unlimited data. For close to half that £60/month you now literally have the world at your fingertips with the hugely valuable and educational YouTube community, insightful TED talks, podcasts to expand your mind, Amazon to save you time and money, and a million other things. Can we really boil all that down to a simple formula of the price paid for telecommunications devices and say we’re not more productive?
Spotify another example of the problems with productivity measurement:
In the early 2000’s you could spend £15 a month to buy one album. Now you pay around £10 a month on Spotify, and you have access to all the music in the world, more or less. Both these contribute roughly the same to the nation’s productivity calculation, i.e. £10-15 of “value” each month, but the value you receive now far exceeds the value of that one album, of which you probably only cared about a couple of songs.
These intangible gains are not captured by our productivity numbers, and yet I would suggest their value is significant.
Technology has been a critical deflationary driver
The growth in commerce online has dramatically increased competition. The likes of Amazon and their deliberate model of staggering growth and zero profitability, combined with the massive leaps forward in e-commerce, online payments, and smartphone ubiquity has made many industries more competitive.
The result of this competition and progress is falling costs for consumers and narrowing margins across Industry. Hence output value divided input value (i.e. productivity) would look sluggish because more of the value is now going to the consumer.
Technology has acted as a significant deflationary driver. Online marketplaces have ensured price transparency for all items and allowed smaller players to compete with big stores as they have a ‘virtual shop front' where they can sell their goods and pay a low overhead to these marketplaces, versus the costs of a bricks and mortar shop.
The consumer is benefitting materially compared to the past, and yet this looks like sluggish productivity according to the usual definition.
Eland Oil & Gas - Cash could exceed mkt cap next year
Fortunes are often made (and lost) on being brave, and Eland Oil & Gas investors need to be brave to cover the Nigeria single country risk and more specifically the militant risk of supply disruption.
Leaving the risks to one side to be revisited further down, the shares trade at incredibly low multiples, and if Management delivers the expected operational progress and production ramp-up over the next 18 months, then there should be a re-rate of the shares.
READ: Is Eland Oil and Gas undervalued?
The analysts are expecting strong production growth in 2018...
Most analysts value these types of oil company shares on a Net Asset Value (NAV) basis to get their target prices. This is usually comprised of a DCF model for each producing field and each field under development, as well as a risked valuation for each discovery that is still in the appraisal phase. The analysts then take off any net debt and so arrive at their
for the Group.
There are seven active analysts covering Eland and their current NAVs range from 96p-149p, compared to the current share price of c.67p. However, this underplays the sizeable cash build up expected over the next 18 months that should easily exceed the current market cap.
Gross production is currently around 19,000 barrels of oil per day (bopd) after bringing on the latest well (named OP 7) at 7,500 bopd production. Well "OP 8" should also complete this year and then in 1Q 2018 wells "OP 9" and "OP 10" should both come onstream taking gross production to 31-37,000 bopd. This range depends on the sustainable flow rates achieved at the three new wells, which are guided at 4-6,000 bopd each. Assuming 80% uptime, that would result in gross realised production of 25-29,000 bopd.
How might that translate to cash flow?
Eland owns half the field but is entitled to all the production cash flow until it has recovered costs from its partner. Assuming a conservative 13,000 bopd net (i.e. Eland's 50% share of an estimated 26,000 bopd gross production) for the whole of 2018 gives approximately $270m revenue and $225m EBITDA at current oil prices.
Timing often slips with oil fields, but this is a conservative estimate. It could be prone to significant upgrades over the coming months if the next three wells match the 7,500 bopd flow rates of the just drilled OP 7 well.
However, the shares are ascribed little value in the market currently based on that 13,000 bopd net production assumption.
Market valuing Eland on a very low multiple
Eland should have circa U$30m net cash year-end 2017 so the Balance Sheet is relatively untroubled, the market cap is c.£140m or U$185m. This means the shares already trade at less than 1x expected EBITDA for 2018. That is an incredibly low multiple that is unlikely to stay there through 2018 if production is delivered.
Assuming capex of around U$60m in 2018 (up 2+ times on 2017) gives a net cash end 2018 of just below the current market cap and by Q1 2019 it should exceed the current market cap.
Alternatively, you could assume a 30-40% payout ratio for 2018 earnings paid in a 2019 dividend (circa 20p) and this would give a yield around 30%. However, the more likely scenario is that management might opt to buy back some stock in 2018 if the share price remains depressed.
This analysis ignores Eland’s ability to grow production further, which looks a very realistic possibility. Analysts' 2019 net production of 16-20,000 bopd range might turn out to be 2018’s figures with a fair wind.
Also read: Should You Be Tempted To Buy Eland Oil & Gas PLC (AIM:ELA) Because Of Its PE Ratio?
Let's get back to the risks...
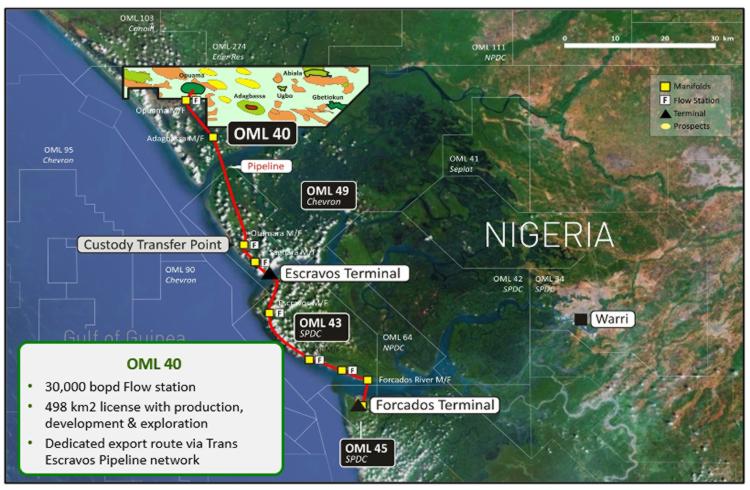
So back to the supply disruption risk, currently all of Eland’s oil and gas goes to the Forcados Shell refinery, this facility spent most of 2016 out of action as its primary pipeline was severely attacked by the Niger Delta Avengers.
Eland was forced to put in place an emergency oil barging operation which went operational for a short period in 2017 proving its viability before the refinery then came back on stream. The barging option remains in place for emergency use only (although is expensive in terms of opex), but this historic outage of production casts a long shadow over the current share price and represents the investment's most significant risk factor.
This is certainly not a low-risk investment, nor would I consider it a core holding. However, I find the value implied by the market at extreme odds to the operational progress that is already underway and the subsequent change in cash generation it should deliver.
-----
To read a brief outline of how I think about stocks, and what I aim to achieve in this blog, please check out my first blog where I set out my stall.
Recent blogs:
- 21 Jun 17 - What changes are needed post Fusionex fiasco
- 5 Jun 17 - Why Labour's Manifesto needs a dose of reality
- 30 May 17 - China shows Western Tech Giants might be stifling innovation
- 8 May 17 - Why corporate chiefs are better leaders than politicians
- 2 May 17 - Why the best businesses have great cash conversion
- 10 Apr 17 - Platforms are taking over the world
- 3 Apr 17 - Bingo player Jackpotjoy offers interesting upside...and risk
- 27 Mar 17 - What Banks and Brokers can learn from Amazon
- 20 Mar 17 - Why understanding behavioural finance is just as important as stock picking
- 14 Mar 17 - What to make of Challenger Banks
- 6 Mar 17 - CFD platforms still worth a look
- 27 Feb 17 - Purplebricks US expansion: How big is the opportunity?
- 20 Feb 17 - M&A - One reason why I’m still bullish on UK equities
- 14 Feb 17 - Anatomy of a growth company
- 6 Feb 17 - Roll-outs: the Good, the Bad and the Ugly
- 30 Jan 17 - How MiFID II could hurt Small and Mid-caps
- 23 Jan 17 - Why Pearson was an obvious value trap, and is Jackpotjoy worth a closer look?
- 16 Jan 17 - How sustainable are current dividends
- 8 Jan 17 - Implications of Trumponomics for equities
- 18 Dec 16 - Millennials - Becoming the most important demographic
- 12 Dec 16 - CFDs - Tough week but worth a closer look
- 5 Dec 16 - Pension deficit dogs starting to look interesting
- 28 Nov 16 - Setting out my stall...plus my thoughts on bond proxies
Please Note: To be clear, I do not and will not ever give any advice. I will rarely mention individual stocks but when I do these will not be recommendations, instead just my thoughts at that point in time.